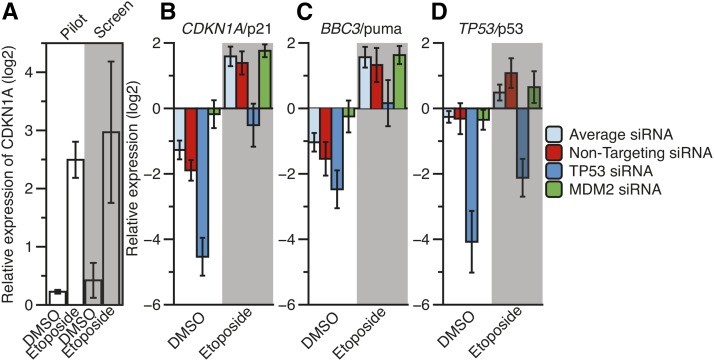
Figure 2.
The normalized, relative expression of CDKN1A/p21 after DMSO or 8 hr of etoposide treatment (100 μM final) in a pilot RT-qPCR screen and in the experimental siRNA screen (A). Average (B) CDKN1A/p21, (C) BBC3/puma, and (D) TP53/p53 expression values under DMSO and etoposide conditions across each experimental RT-qPCR plate for nontargeting, TP53, and MDM2 siRNA. Results from T-tests of pairwise comparisons can be found in Table 1. DMSO, dimethyl sulfoxide; RT-qPCR, reverse transcription-quantitative polymerase chain reaction; siRNA, small interfering RNA.

