Figure 3.
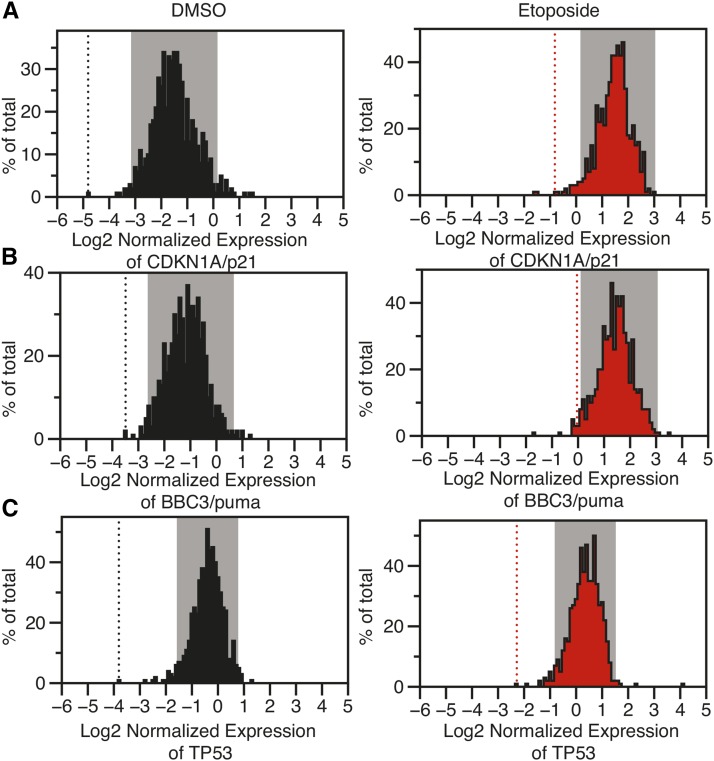
The distribution of relative RNA expression for (A) CDKN1A/p21, (B) BBC3/puma, and (C) TP53/p53. Gray windows represent data with z-scores between –2 and 2. Dotted lines represent the expression value for TP53 knockdown siRNA used as an internal control within the screen. siRNA, small interfering RNA.

