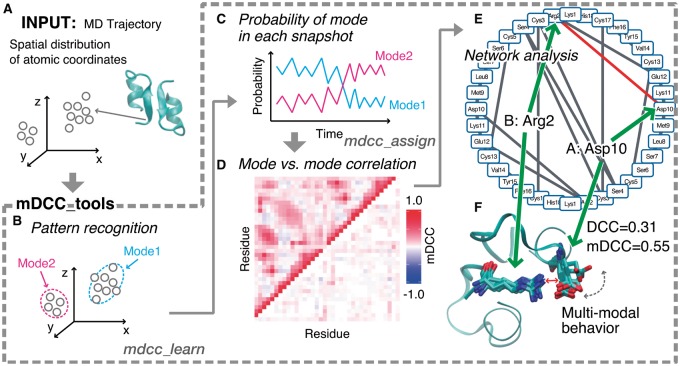
Fig. 1.
Overview of the mDCC analysis. (A) Input data for the analysis. (B) The pattern recognition on the atomic coordinates. (C) Assessing probabilities for each mode. (D) Visualization of all-against-all correlation coefficients. Each column and row indicates each residue. The color gradation from blue to red corresponds to negative and positive correlations. The upper- and lower-triangle depict the mDCC and mDCC-DCC values, respectively. (E) A network diagram. The edges indicate the contacting residue pairs with positive correlation. The interaction including multi-modal behavior is shown as the red edge. (F) An example of multi-modal behavior in engineered endothelin-1 peptide dimer

