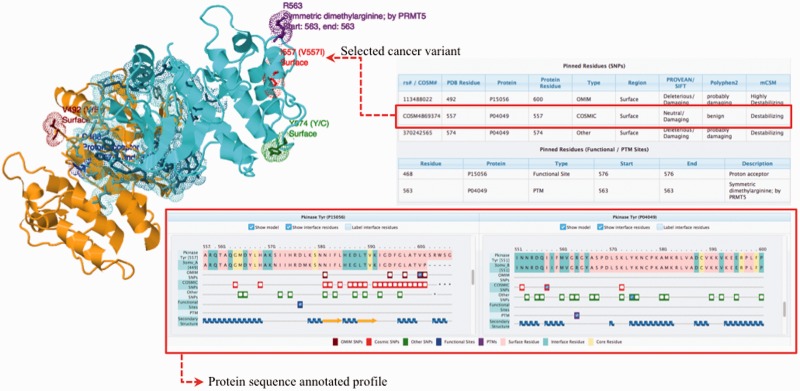
Fig. 1.
PinSnps user interface overview. The complex between Raf1 (P04049, coloured in cyan) and Braf (P15056, coloured in orange) is shown. The protein sequence annotated profile of the complex shows the sequence alignment of the query protein sequence and the available PDB structure sequences. A more detailed description of the platform interactive output is given in the Supplementary Figure S1

