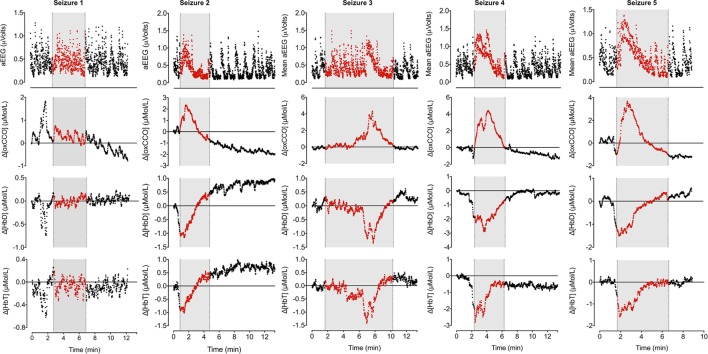
Figure 3.
Changes in mean aEEG, Δ[oxCCO], Δ[HbD], and Δ[HbT] during seizures. Mean aEEG was calculated from F3–C3 channel. NIRS variables have been adjusted to start from 0 on each occasion to reflect the true changes. Periods of electrographic seizures on EEG have been marked in gray and each variable has been marked in red during the seizures. Seizures 2–5 show similar pattern of changes in aEEG, Δ[oxCCO], Δ[HbD], and Δ[HbT]. Δ[oxCCO] increases along with an increase in mean aEEG baseline followed by a drop after peak electrical activity while Δ[HbD] and Δ[HbT] drop early in the preictal period (seizures 2, 4, and 5) and subsequently recover toward baseline. Δ[oxCCO] drops initially in seizures 4 and 5 along with Δ[HbD] and Δ[HbT] but increases with the rise of mean aEEG baseline. Changes in NIRS variables in seizure 1 was similar to other seizures but were noted prior to the onset of electrographic seizure. The first two seizures originated from left posterior hemisphere; the rest were generalized seizures.

