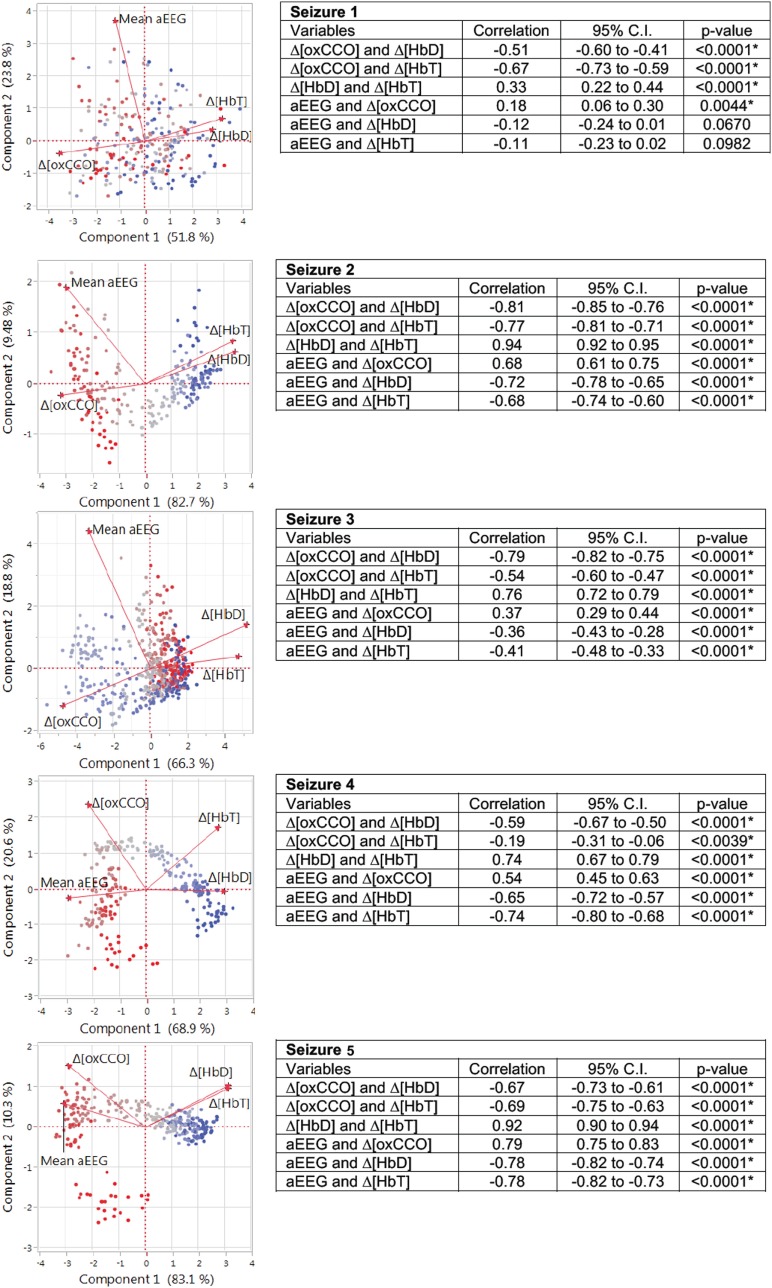
Figure 5.
Matrix of correlation coefficients and corresponding data table for each seizure were analyzed with principal component analysis. Pairwise correlations between the variables with 95% confidence interval (CI) are presented in the table with the significance level. Matrix of correlation coefficients summarizes the strength of the co-relationships between each pair of variables and colors the strength of each correlation on a scale from red (+1 strongest positive correlation) to blue (−1 strongest negative correlation). The closer it is toward 0, the weaker the correlation and color. Mean aEEG was significantly correlated positively with Δ[oxCCO]. Both Δ[HbD] and Δ[HbT] were negatively correlated with mean aEEG and Δ[oxCCO].

