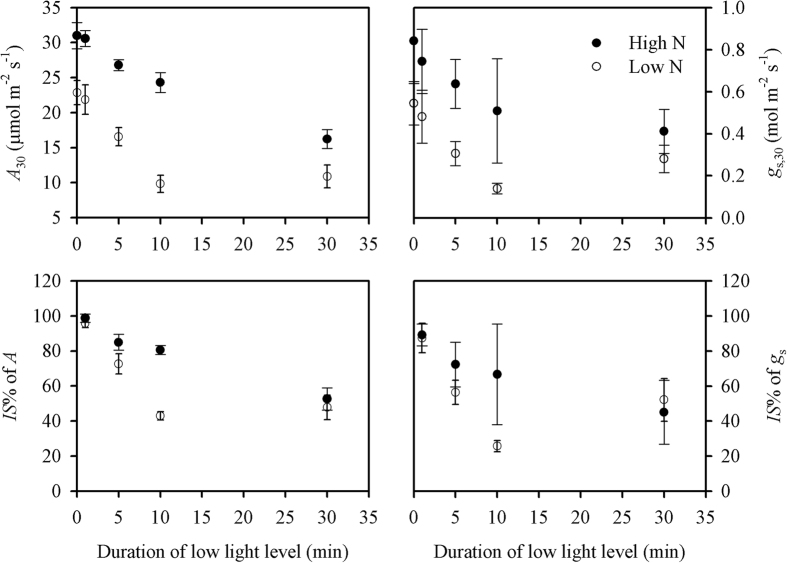
Figure 4. Effects of different N supplies (high N, filled cycles; low N, open cycles) on the responses of A30, gs,30, and the IS% values of A and gs to the duration of the low light level (100 μmol m−2 s−1).
A30 and gs,30 were the instantaneous photosynthetic rate and stomatal conductance, respectively, when shifting from low to high (1500 μmol m−2 s−1) light levels for 30 s. The IS% values of A and gs were the induction state of photosynthesis and stomatal conductance after a period (1, 5, 10 and 30 min) of the low light level. The procedure for the measurement is illustrated in Fig. 2.

