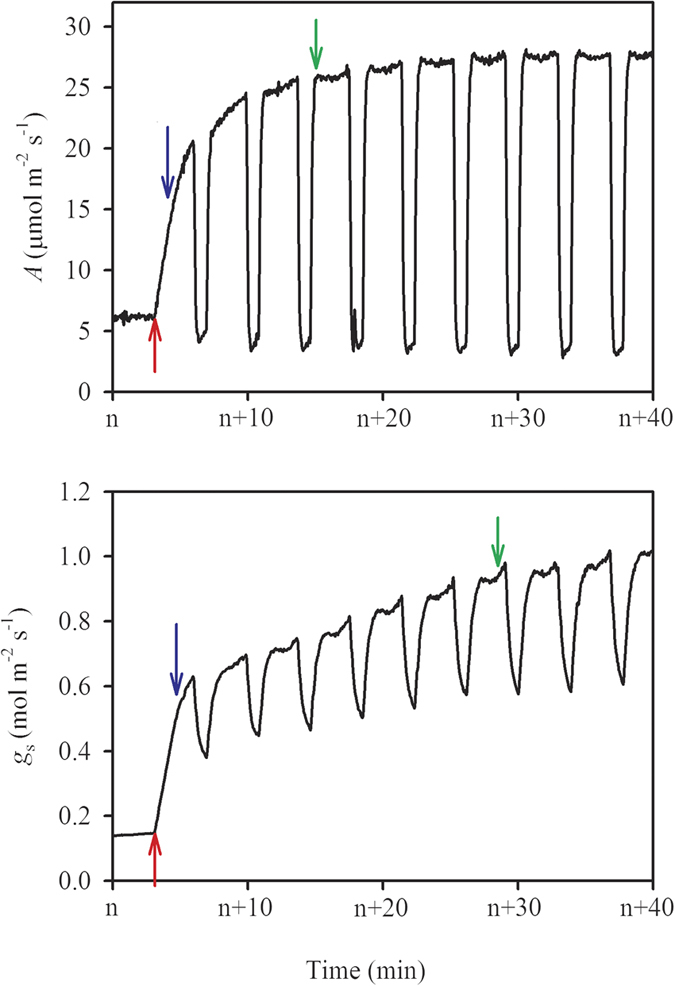
Figure 6. An example for the responses of the leaf photosynthetic rate (A) and stomatal conductance (gs) to flecked irradiance illustrated in Fig. 5.

The red arrow indicate the start of first saturating light, the blue arrows indicate the data points whose instantaneous A and gs reach 50% of the maximum A and gs, and the green arrow indicate the data points whose instantaneous A and gs reach 90% of the maximum A and gs. Times to 50% of the maximum A (T50%A) and the maximum gs (T50%gs) were identified as the times elapsed between the red arrows and the blue arrows, and times to 90% of the maximum A (T90%A) and the maximum gs (T90%gs) were identified as the times elapsed between the red arrows and the green arrows.
