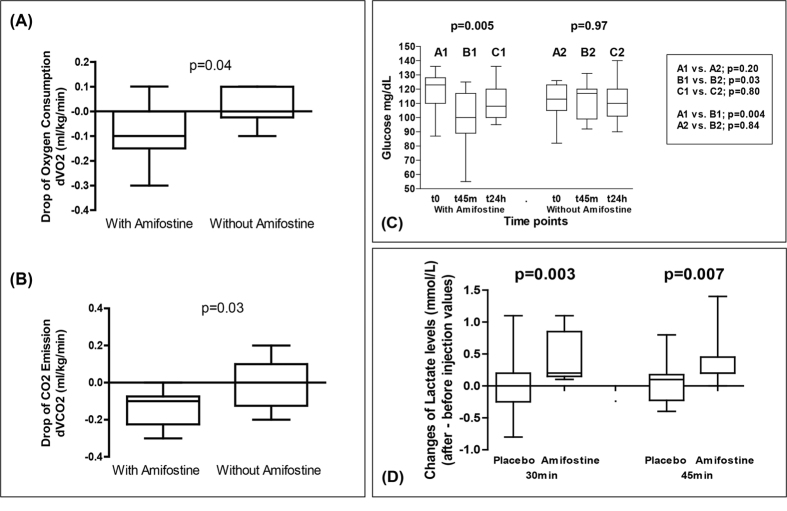
Figure 1.
(A,B) Decrease in oxygen consumption and in carbon dioxide emission from breast cancer patients (indirect calorimetric canopy metabolism assessment) injected with amifostine vs. placebo (d = values after – values before injection). (C) Time course changes of the glucose levels in the venous blood of breast cancer patients injected with amifostine vs. placebo. (D) Time course changes of the lactate levels (final – initial value) in the venous blood of breast cancer patients injected with amifostine vs. placebo. Boxes and whiskers show min and max value, mean value and 25%/75% percentile values. One way ANOVA non parametric analysis (Kruskal-Wallis test) and the Wilcoxon matched pairs test were used to compare groups with continuous variable data.

