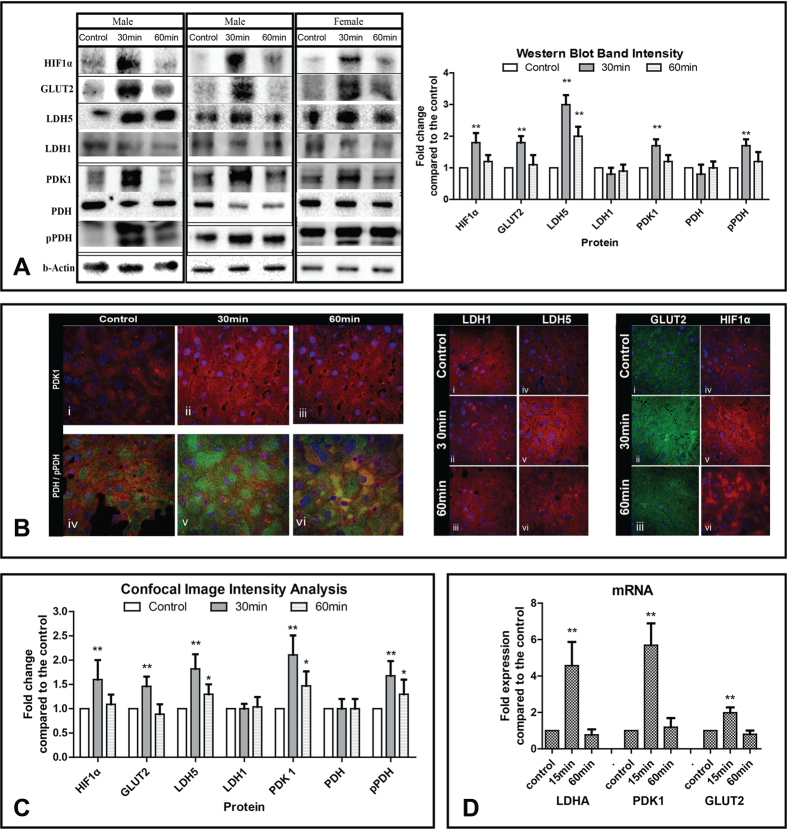
Figure 2.
(A) Western blot images and band densitometry analysis of levels of proteins involved in anaerobic metabolism, as assessed in mouse liver before and after administration of amifostine. Bars show standard deviation and asterisks refer to p-values (*p < 0.05, **p < 0.001). (B) Confocal immunofluorescent microscopy after staining with anti-PDK1/red antibody showing increased cytoplasmic expression in mouse hepatocytes from 0 (i) to 30 min (ii) and regression thereafter (iii). Double immunostaining with PDH/red and phosphorylated pPDH/green (iv), showed an intensification of the expression of the inactive pPDH form of the enzyme 30 min (v) following amifostine injection and trend for restoration of normal PDH levels at 60 min (vi). Confocal immunofluorescent microscopy after staining for LDH1/red showed stable levels of expression in mouse hepatocytes (i,ii,iii). In contrast, LDH5/red expression was sharply induced 30 min following amifostine injection and decreased thereafter (iv, v, vi). Similar patterns were noted for GLUT2 expression (i,ii,iii) and for HIF1α expression (iv,v,iv). (C) Analysis of the fluorescence intensity of confocal microscopy images (from five representative tissue areas for each staining). Bars show standard deviation and asterisks refer to p-values (*p < 0.05, **p < 0.001). (D) mRNA expression levels of LDHA, PDK1 and GLUT2 (three mice for each time point) following exposure to amifostine, as measured with quantitative RT-PCR. Bars show standard deviation and asterisks refer to p-values (**p < 0.001).

