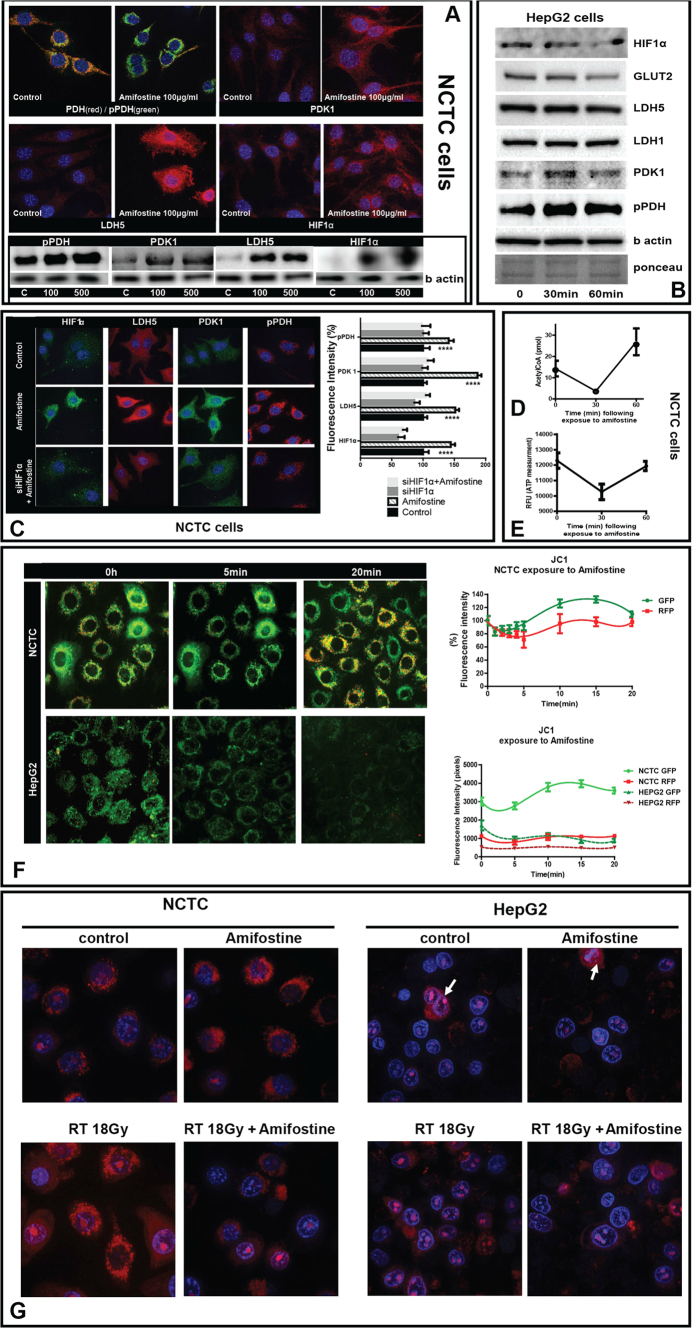
Figure 3.
(A) Confocal microscopy of NCTC liver cells before and after exposure to amifostine (100 μg/ml), for double PDH(red)/phosphoPDH(green), phosphoPDH(red), LDH5 (red) and HIF1α (red) expression. Western blot bands following exposure to 100 and 500 μg/ml of amifostine at 30 min is also shown. (B) Western blot expression of phosphoPDH, PDK1, LDH5 and HIF1α in hepatoma HepG2 cells, at 0, 30 and 60 min following exposure to 100 μg/ml of amifostine. (C) Confocal microscopy of NCTC liver cells before and after exposure to amifostine (100 μg/ml), for HIF1α (green), LDH5 (red), PDK1 (green) and phosphoPDH(red) expression with and without silencing of the HIF1α gene. (D) Acetyl-CoA levels (pmol) in NCTC cells at 0, 30 and 60 min following exposure to 100 μg/ml of amifostine. (E) ATP levels (pmol) in NCTC cells at 0, 30 and 60 min following exposure to 100 μg/ml of amifostine. (F) Time course recording of NCTC and HepG2 cell mitochondrial membrane potentials as assessed with the JC1 method and confocal imaging (0–20 minutes), showed a rapid transient reduction of green (monomer) and red (aggregate) forms of the dye that was subsequently restored to normal levels. (G) Mitochondrial ROS (mtROS) production by NCTC and HepG2 cells, after exposure to 18Gy of ionizing radiation with and without pre-incubation with amifostine, showing a strong effect of amifostine in normal NCTC cells. mtROS were low in hepatoma HepG2 cells compared to NCTC hepatocytes and were increased only in dividing neoplastic cells.

