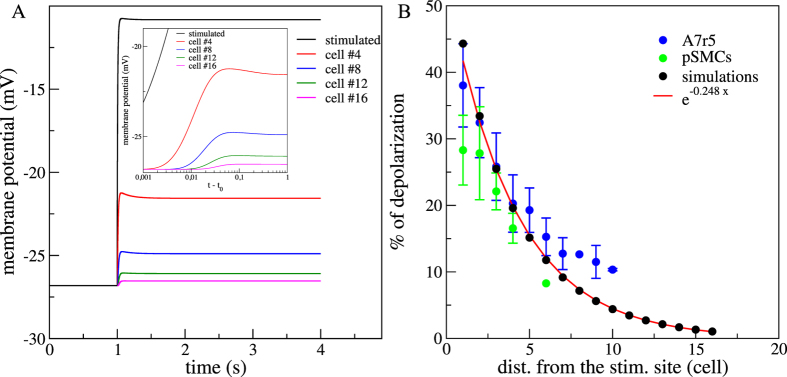
Figure 2.
(A) Numerical results for the time courses of the membrane potential in the simulated control case. Stimulation occurs at t = 1 s. Stimulated cell (black), 4th cell (red), 8th cell (blue), 12th (green) and 16th cell (pink). Inset presents the short time dynamics after stimulation (t0) in lin-log scale. (B) Percentages of membrane depolarization (npSMCs = 16; nA7r5 = 19). The percentages of membrane depolarization were calculated using the maximum depolarization value of each cell and comparing it with the steady state membrane potential before stimulation. Red line fits the exponential decrease with distance from the stimulated site and cell unit is estimated by taking a cell of 150 μm. (npSMCs = 22; nA7r5 = 82).

