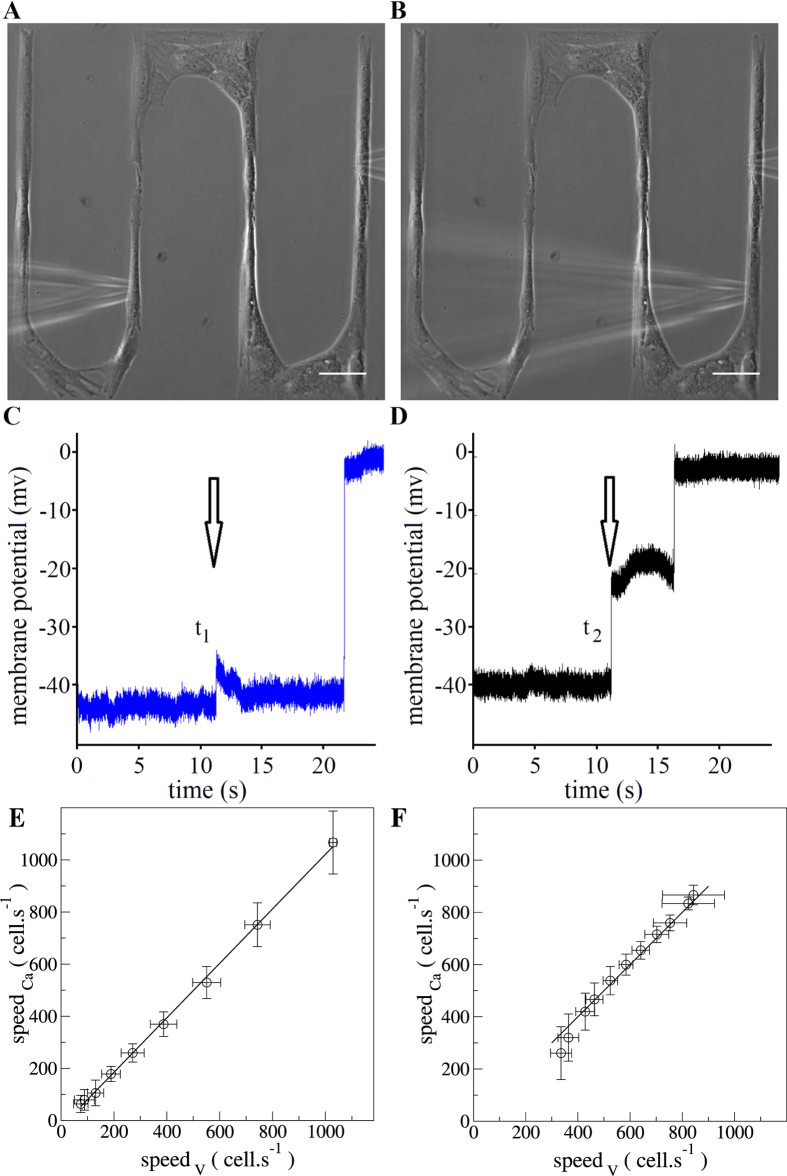
Figure 5. Representative conduction velocity approach in a linear arrangement of SMCs.
Phase contrast images showing the spatial arrangement of the microelectrode (left) and the micropipette (right) in the (A) first and in the (B) second mechanical stimulation attempt. Scale bar: 50 μm. Typical membrane potential recordings in a cell during mechanical stimulation in another cell for the (C) first and for the (D) second attempt. The conduction velocity was calculated by dividing the separation distance between the two impaled cells and the time delayed between the two membrane potential registrations (t1–t2). The arrows in the (C,D) panels indicate the moment when the mechanical stimulation was launched. Theoretical relation between the Ca2+ wave velocity and the propagation speed of membrane depolarization varying g (E) or GCa (F).

