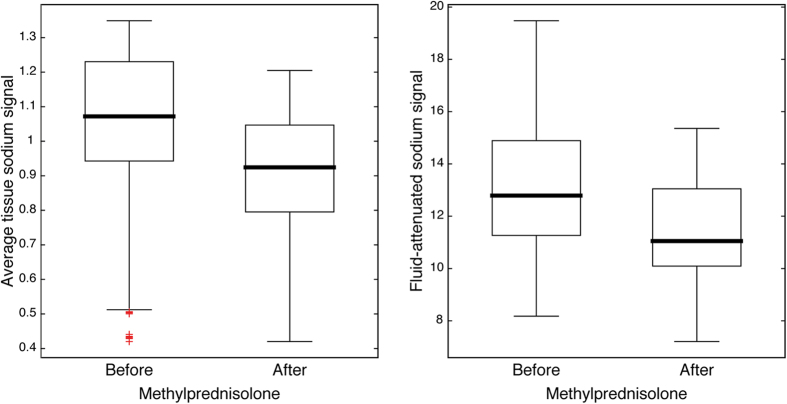
Figure 4. Longitudinal monitoring of all acute MS lesions (PIDs no. 15, 21 and 29).
Sodium signal changes after administration of high-dose methylprednisolone support findings of the cross-sectional analyses. Hierarchical comparisons of average tissue and fluid-attenuated sodium signals across pre- and post-medication measurements revealed a decrease of both signals after the application of high-dose methylprednisolone (cf. Methods and Results section for details).

