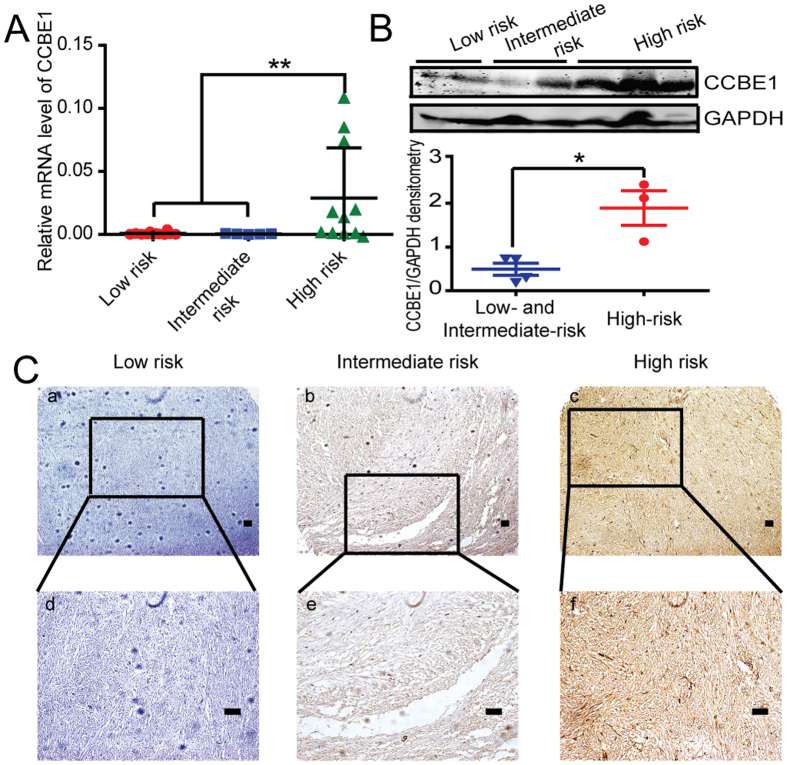
Figure 1. The expression of CCBE1 is gradually up-regulated in accordance with GIST risk grades.
(A) Relative mRNA expression of CCBE1 in high-risk group was significantly higher than those in the intermediate- and low-risk groups, Values are means ± SEM (**P < 0.01). (B) Western blotting analysis showed CCBE1 expression was higher in high-risk samples than the intermediate- and low-risk samples. The densitometric analysis of the results was shown below (*P < 0.05). Glyceraldehyde-3-phosphate dehydrogenase (GAPDH) was included as a loading control. (C) Immunohistochemical staining showed CCBE1 expression in high-, intermediate- and low-risk samples. (Original magnification: a–c, 100×; d–f, 200×. Scale bars, 200 μm).

