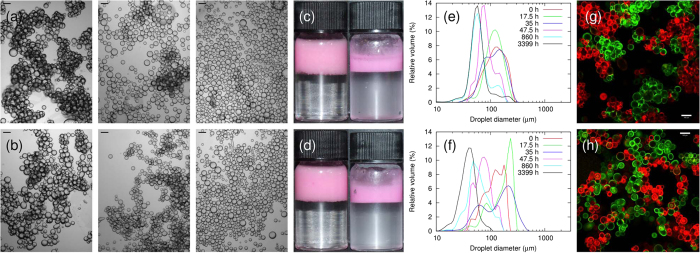
Figure 2. Evolution of two emulsions with different particle contact angles.
(a,b) Micrographs of samples at various rolling times. (a) Sample with ϕp = 0.6% and ΦIM = 50%; the rolling times are, from left to right, 1 h, 185 h and 860 h. (b) Sample with ϕp = 0.6% and ΦIM = 10%; the rolling times are, from left to right, 1 h, 65 h and 185 h; Scale bars are 100 μm. (c,d) Photographs of samples with (c) ΦIM = 50% and (d) 10% at two rolling times. The rolling times are 0 h (left column) and 357 h (right column). (e,f) Apparent size distributions of the sample with ϕp = 0.6% and (e) ΦIM = 50% or (f) ΦIM = 10% at various rolling times. (g,h) Confocal micrographs of samples with ΦIM values of (g) 50% and (h) 10%, after being on a roller bank for 3.5 h. The clusters in the sample with ΦIM = 10% are more thoroughly mixed than those in the sample with ΦIM = 50%; the scale bars are 100 μm.

