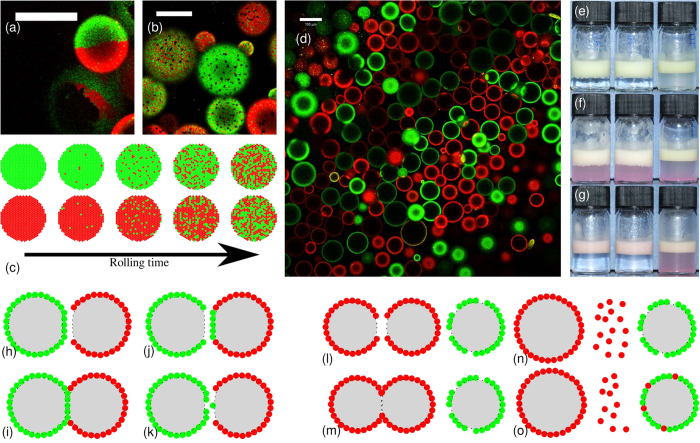
Figure 5. Mixing on the droplet interfaces.
(a) Image of the ΦIM = 10% sample after rolling for 13 h showing the detail of a Janus droplet; the scale bar is 50 μm. (b) ΦIM = 10% sample following 185 h of rolling showing the detail of bare patches (dark spots) which are thought to be caused by particle transfer; the scale bar is 50 μm. (c) Cartoon showing particle transfer in two-colour samples. (d) Confocal micrograph of a sample containing 30 mM sodium chloride, following 280 h of rolling; the scale bar is 100 μm. (e–g) Photographs showing free silica particles adsorbing to the oil-water interface in emulsions. In each photograph, the sample on the left has ΦIM = 10%, the centre sample has ΦIM = 50% and the sample on the right has ΦIM = 10% and an aqueous NaCl concentration of 30 mM. (e) The samples following emulsification. (f) The samples following addition of the extra particles. (g) The samples following 1 h of rolling. (h–k) Cartoons showing two possible routes for droplet interfaces to become heterogeneous during disaggregation of a bridged Pickering emulsion. (h–i) A fully coated droplet collides with a partially coated droplet, forming a particle bridge. (j–k) The particle bridge is broken, leading to a patchy droplet or single particle transfer. (l–o) Cartoons showing a tentative route for particle re-adsorption. Two partially coated droplets coalesce, leading to the release of some particles into the continuous phase. These particles are then able to adsorb to the interface of a third partially coated droplet.

