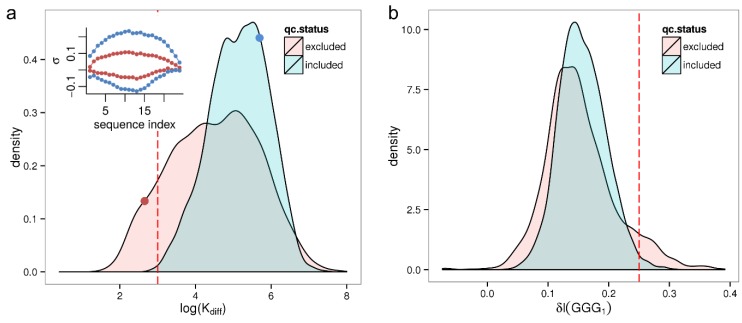
Figure 4.
Distribution of summary parameters related to sequence effects for qc-included/qc-excluded samples of the HumanExpressionAtlas. Panel (a) shows the parameter log(Kdiff) as a measure of the total strength of the sequence effect. The inset shows the corresponding sequence profiles for two selected samples (red and blue dots, in the same color as the profiles); Panel (b) shows the intensity increase due to the (GGG)1 motif, δI(GGG)1.

