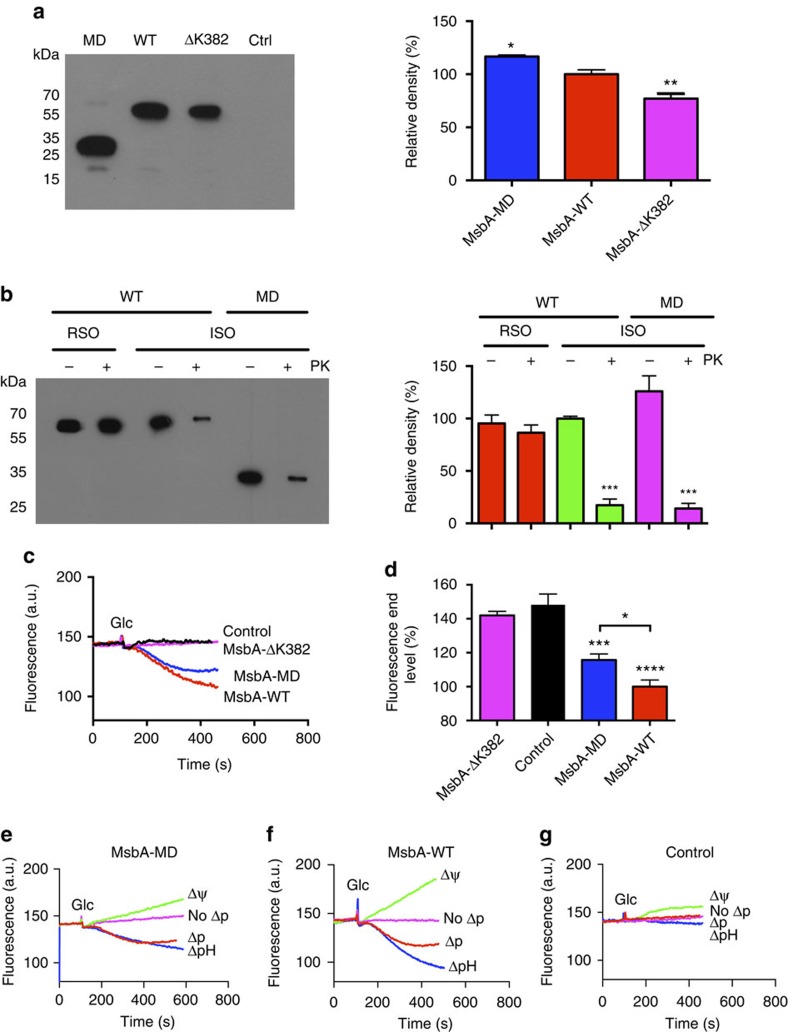
Figure 1. Ethidium efflux in intact cells.
(a) Immunoblot probed with anti-polyhistidine tag antibody (left) shows that MsbA-MD and MsbA-ΔK382 are expressed in the plasma membrane of L. lactis (5 μg total membrane protein per lane) at 117% and 77% of MsbA-WT, respectively, and that these proteins are absent in control cells (Ctrl). The migration of molecular mass markers is indicated. Histogram (right) shows MsbA signal intensities. (b) Availability of the cytosolic NH2-terminal His-tag in MsbA-WT and MsbA-MD to cleavage by proteinase K (+PK) at the external side of right-side-out (RSO) or inside-out (ISO) membrane vesicles (3 μg protein per lane). Incubation without the protease (-PK) served as control. Uncleaved His-tag was detected on immunoblot (left). Signal intensities are shown in the histogram (right). (c) Efflux of monovalent cationic ethidium was initiated by the addition of 20 mM glucose (Glc) as a source of metabolic energy to ATP-depleted cells that were preloaded with 2 μM of the dye. Efflux was observed for MsbA-WT but not for non-expressing control or MsbA-ΔK382, which exhibits a strongly reduced ATPase activity due to the absence of the catalytic Walker A lysine residue. Remarkably, ethidium efflux was also observed for a truncated form of MsbA-WT that lacks the NBD (MsbA-MD). (d) Histogram shows significance of fluorescence levels in (c) at t=400 s. (e–g) Ethidium efflux from cells containing MsbA-MD (e), MsbA-WT (f) or no MsbA proteins (g) to which ionophores nigericin (Δψ only, interior negative), valinomycin (ΔpH only, interior alkaline) or both (no Δp) were added at concentrations of 1.0 and 0.1 μM, respectively, 3 min prior to the addition of the glucose. Data represent observations in 3 or more independent experiments with independently prepared batches of cells. Values in histograms are expressed as mean±s.e.m. (one-way analysis of variance; *P<0.05; **P<0.01; ***P<0.001; ****P<0.0001).

