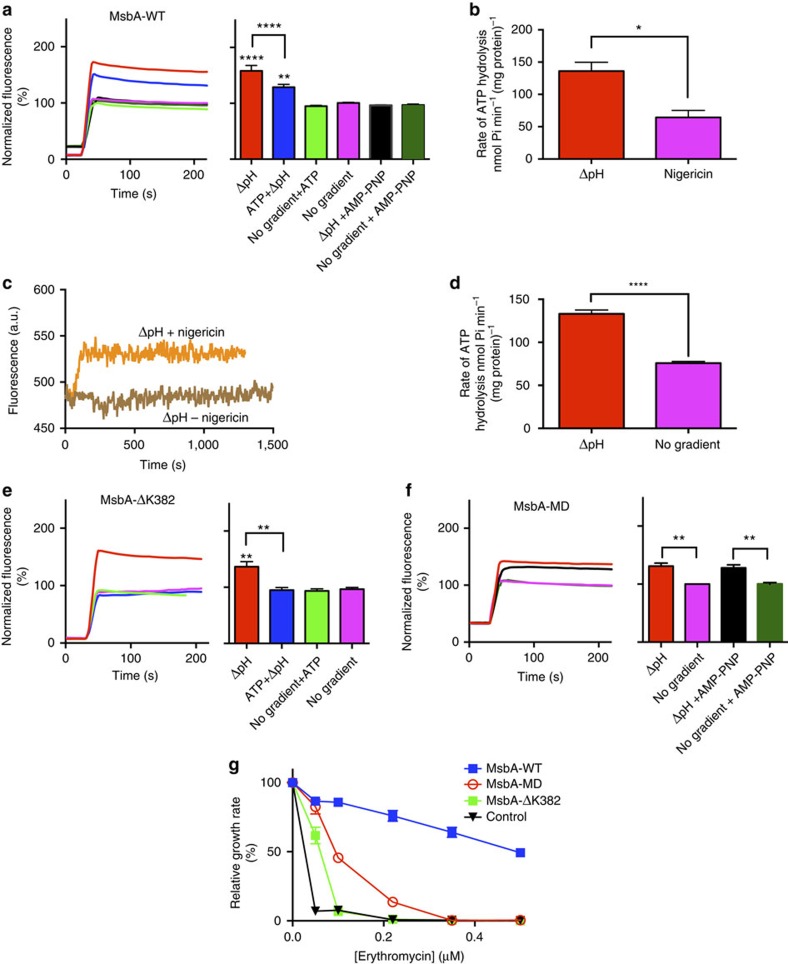
Figure 6. Relationship between ATP dependence and proton coupling by MsbA proteins.
(a) Effect of the presence of 2.5 mM Mg-ATP or non-hydrolyzable nucleotide analogue AMP-PNP on imposed ΔpH (pHin 6.8/pHout 8.0)-dependent ethidium transport by MsbA-WT in DNA-loaded proteoliposomes. Histogram shows significance of fluorescence levels at steady-state. (b,c) MsbA-WT ATPase activity in proteoliposomes in which the ΔpH (pHin 6.8/pHout 8.0) was dissipated in the presence of nigericin (leading to pHin 8.0/pHout 8.0) (b). This action of nigericin was confirmed using proteoliposomes (pHin 6.8/pHout 8.0) loaded with the pH probe BCECF (brown trace), the fluorescence emission of which was enhanced by the increase in the lumen pH from 6.8 to 8.0 by the addition of the ionophore at t=0 s (orange trace) (c). (d) MsbA-WT ATPase activity in proteoliposomes in the presence of an imposed ΔpH (pHin 6.8/pHout 8.0) or its absence (pHin 8.0/pHout 8.0). Note that the pH near the NBD of MsbA (at the external side of the proteoliposomes) remains constant in the experiments displayed in (b) and (d). (e,f) Experiments as described in (a) in proteoliposomes containing MsbA-ΔK382 (e) or MsbA-MD (f). (g) Erythromycin resistance in cells expressing MsbA-WT (blue squares), MsbA-MD (red circles), MsbA-ΔK382 (green squres) compared to non-expressing control cells (black triangles). Maximum specific growth rate (μmax) was determined at each erythromycin concentration and is presented as a percentage of μmax in the absence of erythromycin. The error bars for some of the data points in (g) were too small to be displayed, and are hidden behind the data point symbols. Data represent observations in 3 or more independent experiments with independently prepared batches of proteoliposomes or cells. Values in histograms are expressed as mean±s.e.m. (one-way analysis of variance except for (b,d) unpaired student-t test; *P<0.05; **P<0.01; ****P<0.0001).

