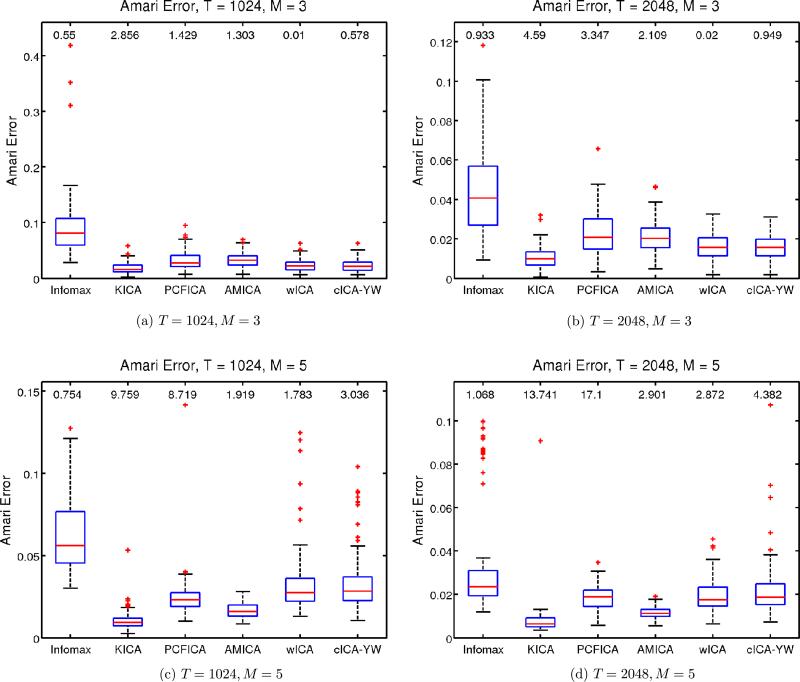
Figure 3.
Simulation Study II: Performance comparison for white noise sources. Sample sizes T = 1024, 2048. Number of sources M = 3, 5. The boxplots show the Amari error between the true unmixing matrix and the estimated unmixing matrix obtained by various ICA methods. The median computation time of each method is provided on top of the corresponding boxplot. The wICA and cICA–YW provide comparable estimates as the other existing ICA methods. Infomax stands for the extended Infomax as described in the text.

