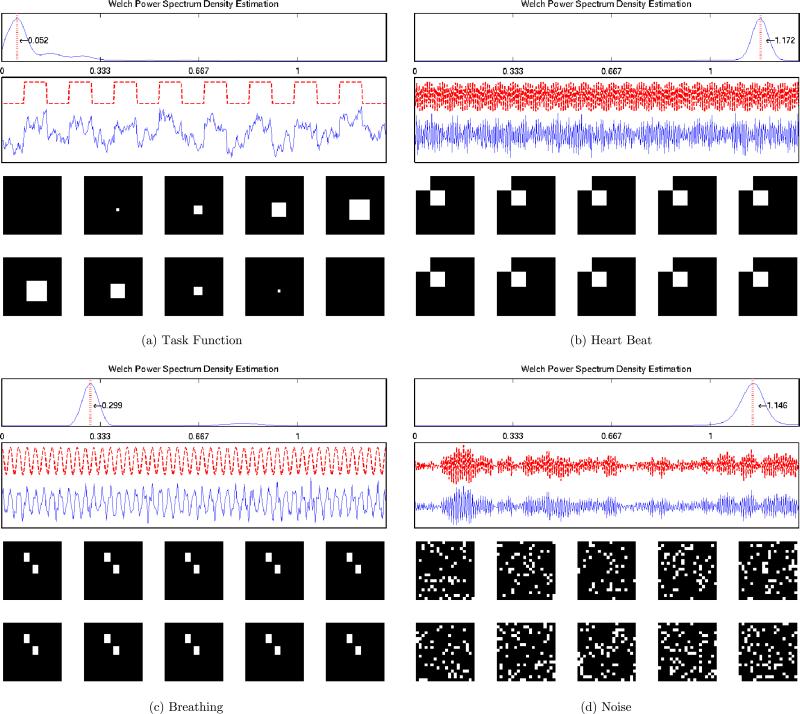
Figure 5.
Simulation Study III: The true independent temporal components, spectral densities and spatial maps. The four temporal signals (task, heartbeat, breathing, and noise) are displayed sequentially from top left to bottom right with the corresponding spatial maps. The activated voxels are colored as white and nonactivated voxels are colored as black.

