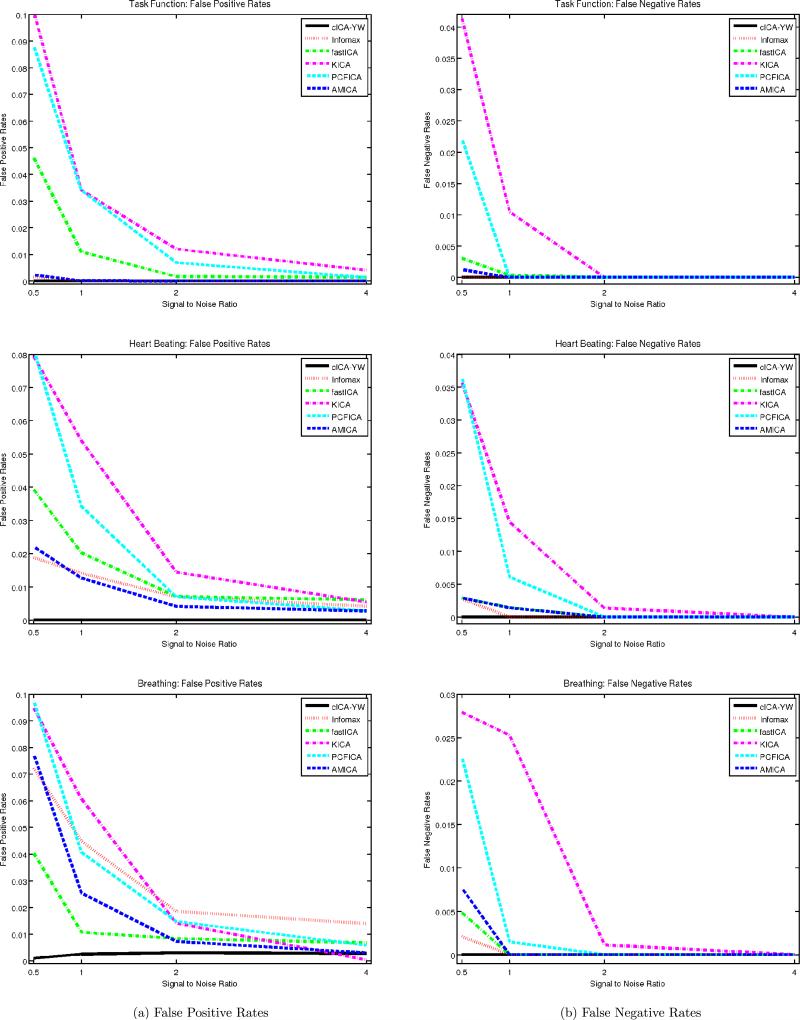
Figure 6.
Simulation Study III: Comparisons of false positive and false negative rates. Four different SNRs are considered. False positive and false negative rates are averaged over 100 simulation runs and displayed at left and right columns respectively. The cICA performs uniformly better than the other five methods.

