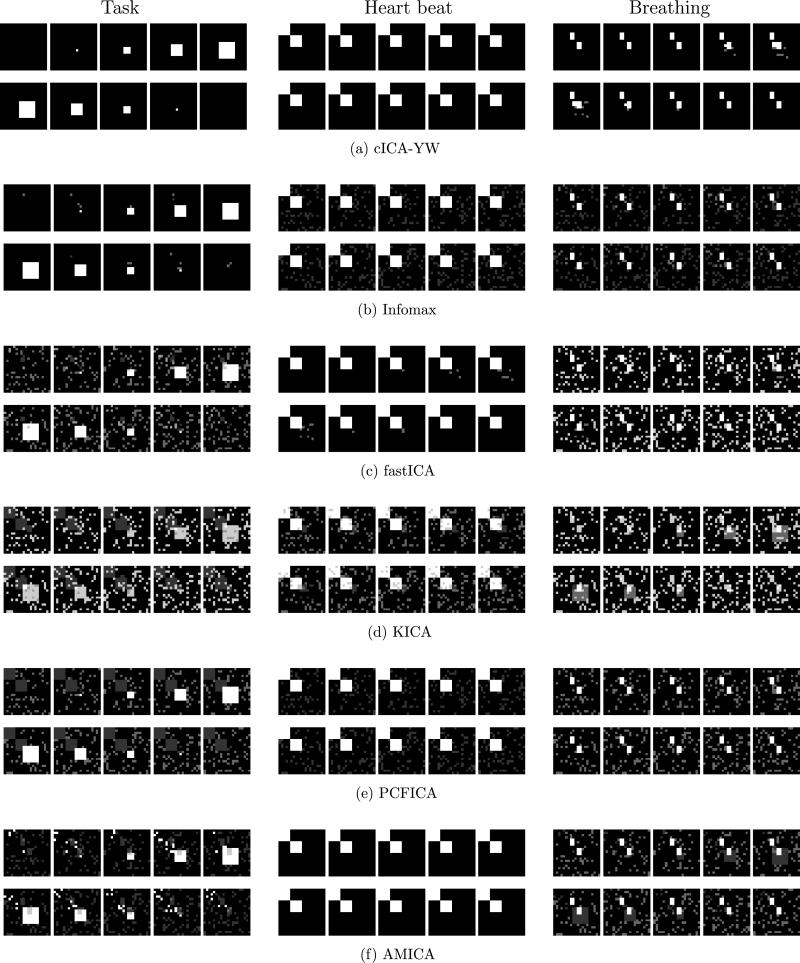
Figure 7.
Simulation Study III: Spatial maps detected by cICA–YW, Infomax, fastICA, KICA, PCFICA, and AMICA under SNR = 1. The average spatial maps (the relative frequency of each voxel detected as activated out of the first five runs) are colored using white (1) to black (0) with gray scale. The cICA–YW detects the spatial activation much better than the other ICA methods.

