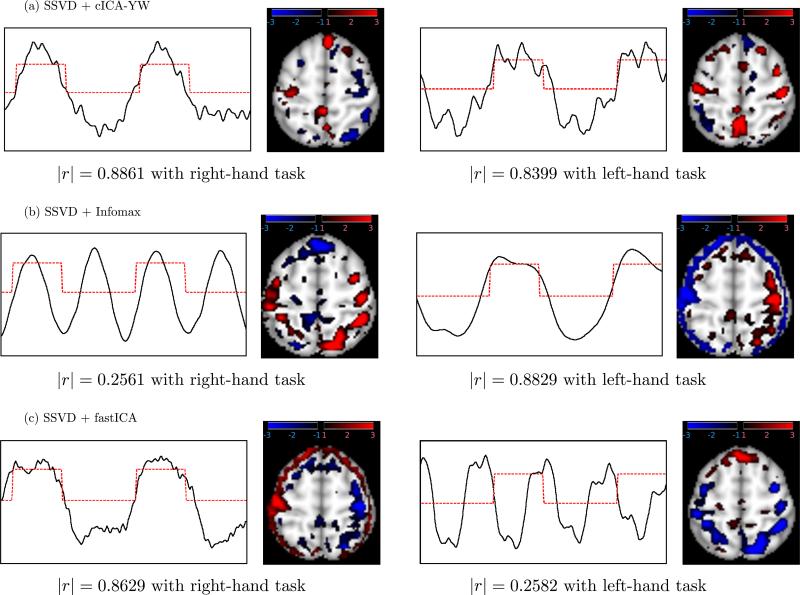
Figure 9.
Real fMRI analysis: Temporal independent components (ICs) and corresponding spatial maps for (a) cICA–YW, (b) Infomax, (c) fastICA. The ICs (black solid lines) of the first two components having the largest absolute correlation (indicated) with finger-tapping tasks (red dash lines) are displayed. Activated areas are colored blue–black or red–black gradient in the spatial maps. The comparison (Figures 9 and 10) suggests that cICA–YW can recover the task-related signals of interest more accurately; in addition, it can detect the regions activated by the tasks more sensitively.

