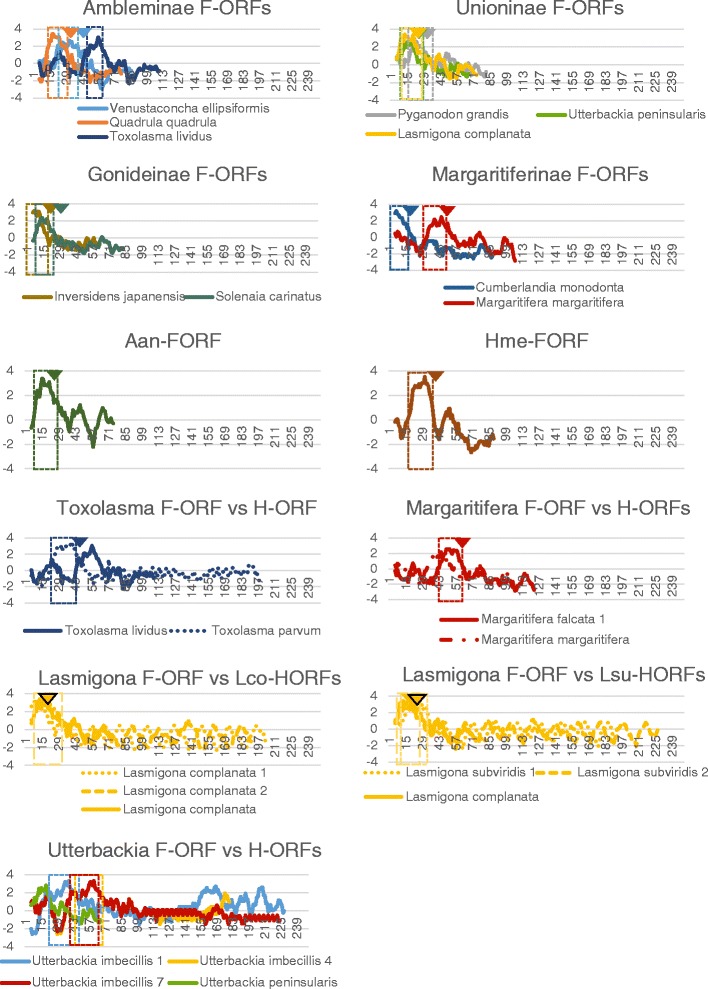
Fig. 5.

Hydrophobicity profiles of F-ORFs (top) and H-ORFs vs. F-ORFs (bottom). Boxes indicate predicted TM helices, arrowheads indicate the end of predicted SPs. X-axis is amino acid position, Y-axis is hydrophobicity. Aan, Anodonta anatina; Cmo, Cumberlandia monodonta; Hme, Hyridella menziesii; Lco-HORFs, Lasmigona compressa H-ORFs; Lsu-HORFs, Lasmigona subviridis H-ORFs. For hermaphroditic species, only sequences with different hydrophobicity profiles are shown
