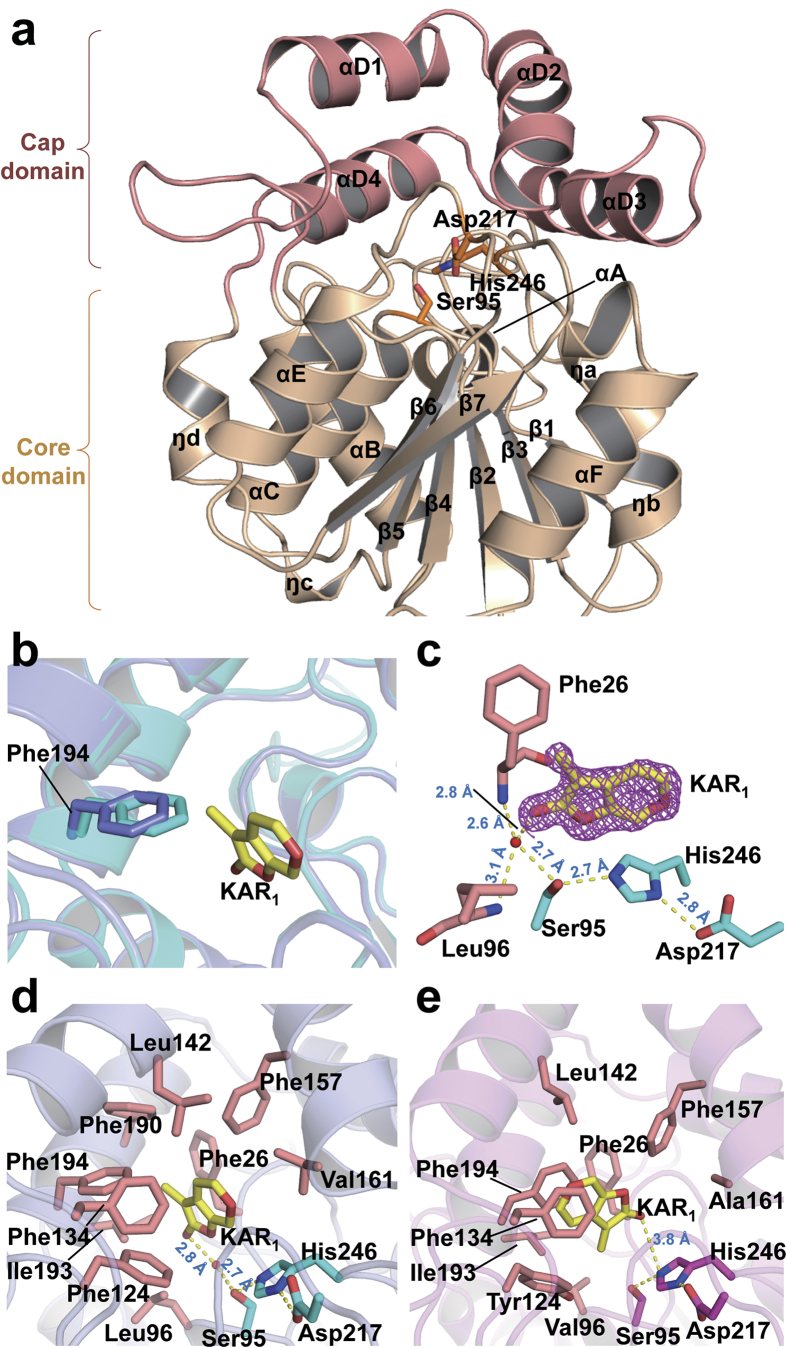
Figure 2. Structures of ShKAI2iB and its KAR1 complex.
(a) Structure overview of ShKAI2iB in a ligand-free (apo) state. Cap domain and core domain are colored salmon and wheat, respectively. Catalytic triad residues are indicated as cyan sticks. (b) Structural alignment of apo- (cyan) and KAR1-bound ShKAI2iB (purple). Phe194 and KAR1 (yellow) are highlighted in stick model. (c) Hydrogen-bonding network between KAR1 and the catalytic residues of ShKAI2iB. KAR1 is shown by a yellow stick and contoured 2Fo-Fc map (Pink mesh) at level of 1.0σ. Catalytic triad residues are highlighted in cyan sticks and the residues for oxyanion hole are in salmon sticks. Red sphere represents water molecule. Hydrogen bonds and their lengths are represented using dashed lines and blue values (Å), respectively. (d,e) Binding modes of KAR1 in the cavity of ShKAI2iB (d) and KAI2 ((e) PDB ID 4JYM). Residues surrounding KAR1 (yellow) are highlighted in salmon sticks. Catalytic triad residues of ShKAI2iB are shown as cyan sticks and those of KAI2 are shown in magenta sticks. Red spheres stand for water molecules. Hydrogen bonds are represented by yellow dashes and lengths are shown with blue values (Å).

