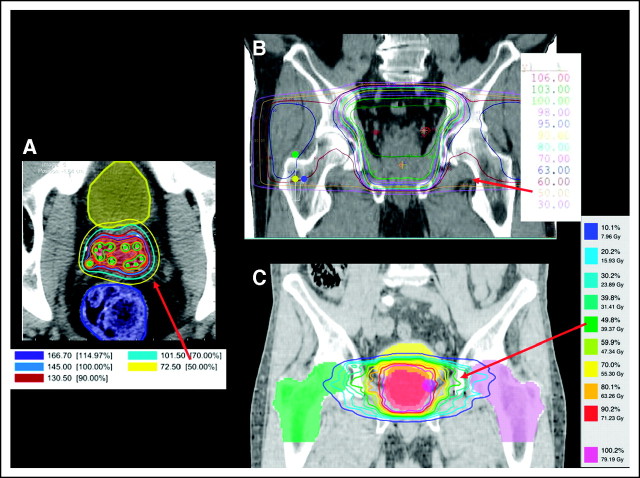
Fig A1.
Estimating marrow exposure from radiation therapy: example from treatment of prostate cancer. Radiation therapy planning generates a set of isodose lines that indicate the dosage to the tissue contained therein. Each colored line represents a different percentage of the total prescribed dose. For example, the red arrow in each picture points to the 50% isodose line; the tissue contained within that line will receive 50% of the prescribed dose. More conformal treatment techniques expose less normal tissue to radiation, including marrow. (A) Axial image representing postimplant dosimetry after prostate seed brachytherapy. (B) Coronal image depicting treatment of a small pelvic field using four beams (similar to the “four-field box” plans that were more common before the year 2000). (C) Coronal images of an intensity-modulated radiation therapy plan to treat the prostate (typical treatment after the year 2000).

