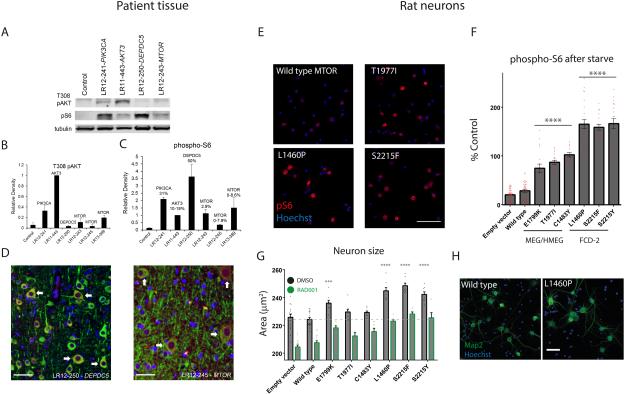
Figure 4. Functional consequences of PI3K-AKT-mTOR pathway mutations in patient tissue and rodent neurons.
Panel A shows representative Western blots comparing levels of T308 AKT phosphorylation (PI3K-PDK1-dependent) to ribosomal protein S6 phosphorylation (mTORC1-dependent) in control and dysplastic brain specimens containing the indicated mutations. Specimens with “upstream” pathway mutations (PIK3CA, AKT3) have the highest levels of AKT phosphorylation, while specimens with “downstream” mutations (DEPDC5, MTOR) exhibit elevation of phospho-S6 with lesser elevation of T308 phospho-AKT. Panels B and C show averaged results from five blots for T308 phospho-AKT (B) and phospho-S6 (C). Panels in D show phosphorylated ribosomal protein S6 expression at high power, indicating activation of the PI3K-AKT-mTOR pathway, in a subset of neurons in dysplastic human cortex with DEPDC5 or MTOR mutations. Green = MAP2 neuronal marker, Red = phospho-S6, Blue = DAPI nuclear stain. Arrows indicate dysmorphic neurons co-expressing MAP2 and phospho-S6, which appear orange in color. Scale bars = 50 μm.
Panel E shows representative images of phospho-S6 indirect immunofluorescence of rat neurons electroporated with indicated wild-type or mutant MTOR constructs. Scale bar = 100 μm. Panel F quantifies average phospho-S6 immunofluorescence intensity for DIV12 neurons transfected (NeuN positive, HA-tag/ZsGreen positive) with MTOR or empty vector constructs as indicated, and treated with amino acid and growth factor starvation for 2 hours. Data are baseline subtracted (phospho-S6 values in empty vector transfected neurons treated with 200 nM RAD001) and normalized to phospho-S6 immunofluorescence intensities in wild-type MTOR neurons in normal media. Data points represent averages per individual wells; columns and error bars are means across wells and standard error of means. Asterisks and lines represent significant differences between genotypes (ANOVA, Tukey’s test for multiple comparisons, comparing each condition to every other condition). Within each group (E1799K, T1977I, C1483Y; or S2215F, S2215Y, L1460P), data for individual genotypes are significantly different from genotypes in each other group or controls (empty vector and wild type MTOR electroporated neurons) at a significance level of p < 10-4. Panel G shows average neuronal size (cell body area encompassed by NeuN stain) for transfected neurons treated from DIV7-DIV14 with DMSO or 200 nM RAD001. 1 nM RAD001 intermediately reduced size (not shown). Asterisks denote significant difference of neuronal size for a given genotype compared to wild-type MTOR (ANOVA, Dunnett’s test for multiple comparisons). For every genotype, RAD001 significantly reduced neuronal size (p < 10-3 or less). See also figure 8 in supplemental appendix for size analysis of neurons at DIV12, distributions of phospho-S6 and cell sizes across cells, and representative NeuN immunostaining. Panel H shows representative fields of immunostaining for Map2 and Hoechst. Scale bar = 50 μm.

