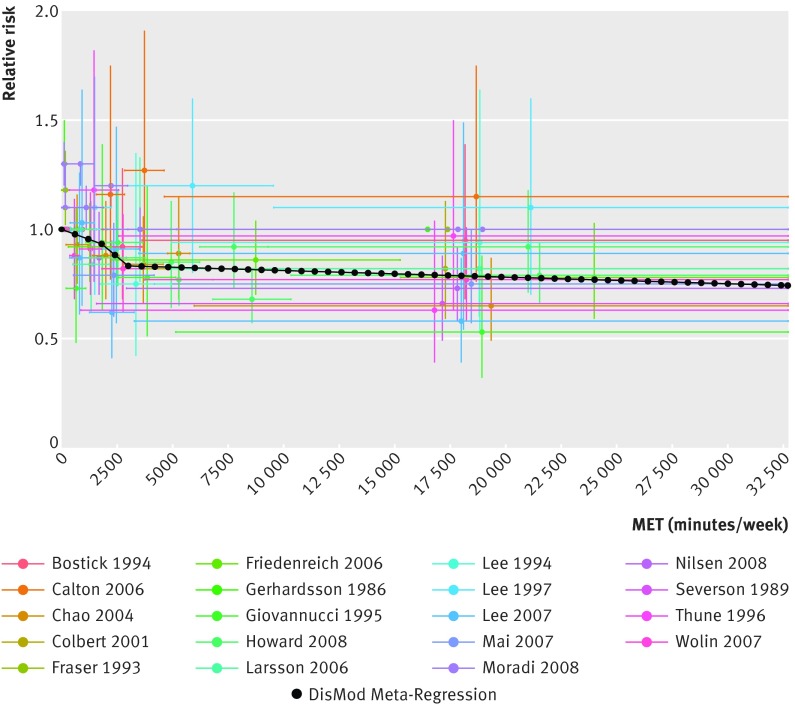
Fig 3 Continuous risk curve for association between physical activity and colon cancer. For each datapoint in included studies, which are represented by different colors, length of horizontal bar refers to total physical activity interval in MET-minutes/week and vertical bar refers to confidence interval of relative risks

An official website of the United States government
Here's how you know
Official websites use .gov
A
.gov website belongs to an official
government organization in the United States.
Secure .gov websites use HTTPS
A lock (
) or https:// means you've safely
connected to the .gov website. Share sensitive
information only on official, secure websites.
