Figure 5.
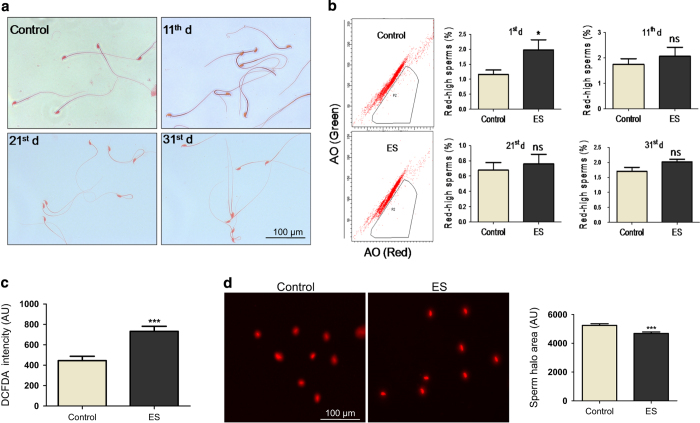
Evaluation of effect of ES on epididymal sperm integrity. (a) Microscopic analysis of sperm morphology on ES exposure (3 mg/kg) at different time points (0, 10, 20 and 30 days) post-treatment completion. Samples are stained with Eosin Y. (b) Representative FACS analysis of sperm chromatin structure assay. P2 represents red-high sperm indicating loss of chromatin integrity in epididymal sperm cells. Bar graphs show cumulative red-high sperm obtained from ES-treated mice (3 mg/kg) at various time points (10, 20 and 30 days; n=5 per group). (c) Bar graphs indicating the epididymal sperm ROS levels following exposure to ES (3 mg/kg) measured using DCFDA staining followed by FACS (n=9 and 11 for control and ES, respectively). (d) Propidium Iodide-stained sperm heads after sperm dispersion assay (halosperm assay) performed on the epididymal sperm sample that exhibited highest ROS (detected in FACS) following treatment with ES (3 mg/kg). Bar graphs indicate the quantitative representation of the sperm halo area in control and treated groups (n=210 and 179 in control and treated, respectively).

