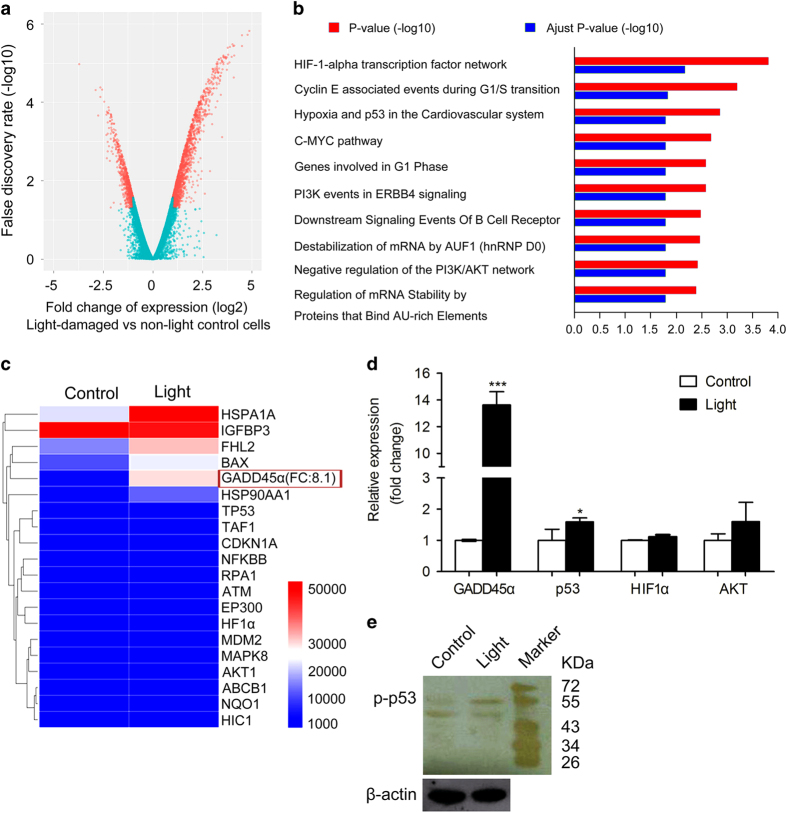
Figure 3.
Gene expression profiling. (a) Schematic representations of the gene expression profiling in human OneArray experiments carried out in ARPE-19 cells. (b) Gene ontology (GO) analysis demonstrated differentially expressed pathways between non-light-damaged and light-damaged cells. (c) Gene expression signature of light-damaged ARPE-19 cells in the p53 hypoxia pathway. (d) Quantitative RT-PCR was performed to confirm the results from our GO analysis. mRNA levels were standardized to the control gene β-actin. Results are presented as mean value±S.E.M. (n=3, *P<0.05, ***P<0.001). (e) Western blotting showed upregulation of p-p53 in light-damaged cells. The β-actin loading control is from the same experiment as shown in Figure 5a and is reproduced in this figure for ease of reference.

