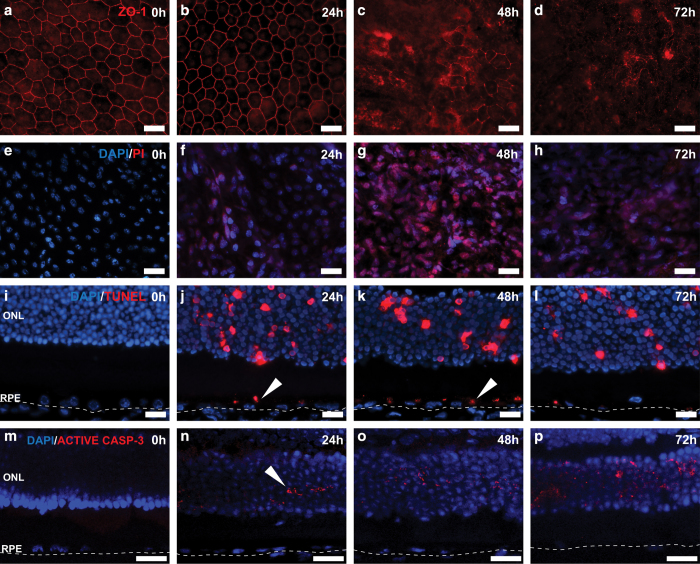
Figure 3.
Molecular hallmarks of RPE degeneration in C57BL/6J mice RPE after retro-orbital NaIO3 administration. (a–d) Tight junctions in the central retina were visualized by ZO-1 staining. At 48 h post 20 mg/kg NaIO3 administration, compromise of tight junctions was visible indicating impairment of the blood–retina barrier (n=6 each). (e–h) Flatmount DAPI and PI staining highlighted necrotic RPE cells as early as 24 h post NaIO3 administration. At 72 h, areas with diffused PI signal were seen (n=6 each). (i–l) TUNEL staining was used to highlight dying cells in the retina. Both RPE cells and photoreceptors were TUNEL-positive as early as 24 h post 20 mg/kg NaIO3 administration (n=6 each). (m–p) Active caspase-3 staining was observed only in the photoreceptor layer at all analyzed time points (n=5 each). The scale bar is 25 μM.

