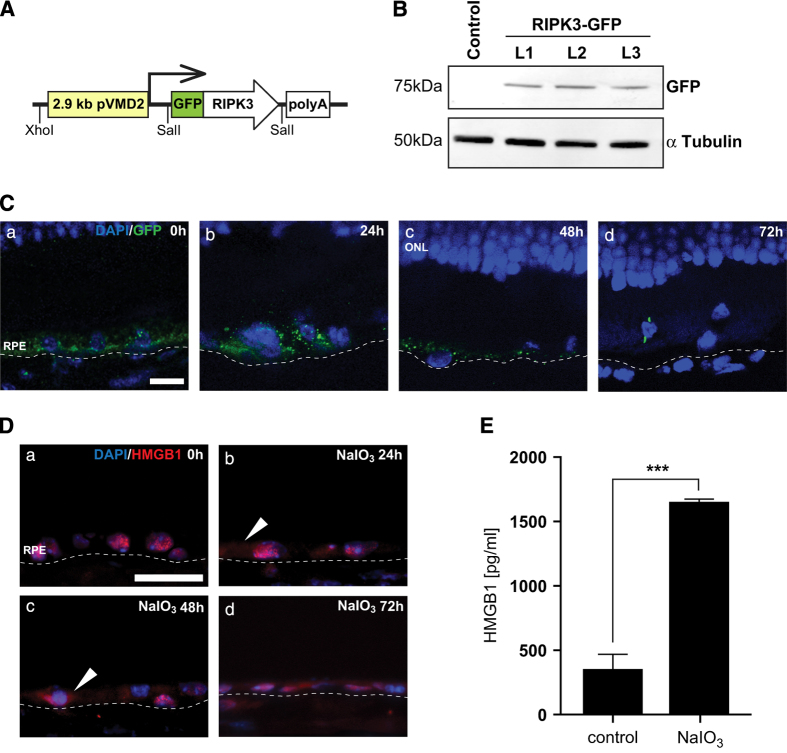
Figure 4.
Characterization of the necroptosis in vivo by using pVMD-RIPK3-GFP transgenic mice and by visualizing HMGB1 release. (A) Schematics of the construct for transgenic mice. (B) Confirmation of transgene expression in three lines (L1-L3) by western blot. (C) RIPK3-GFP expression in the RPE layer of RIPK3-Tg mice was visualized by GFP staining (a), RIPK3-GFP aggregation as a result of 20 mg/kg NaIO3 was visible at 24 and 48 h (b and c) post administration. Very few GFP staining was observed at 72 h (d) (n=5 each). The scale bar is 10 μM. (D) Release of HMGB1 from the nucleus of RPE cells was visualized by HMGB1 staining. In normal RPE cells, HMGB1 is located in the nucleus (a), and 24 h after 20 mg/kg NaIO3 administration, HMGB1 was released into the cytoplasm (b, arrowheads). At 48 and 72 h, extranuclear HMGB1 can be observed in the RPE cell layer (c and d, arrowheads) (n=5 each). The scale bar is 25 μM. (E) HMGB1 release was measured in the vitreous humor using ELISA (n=3 each). ***P<0.001.

