
Figure 1.
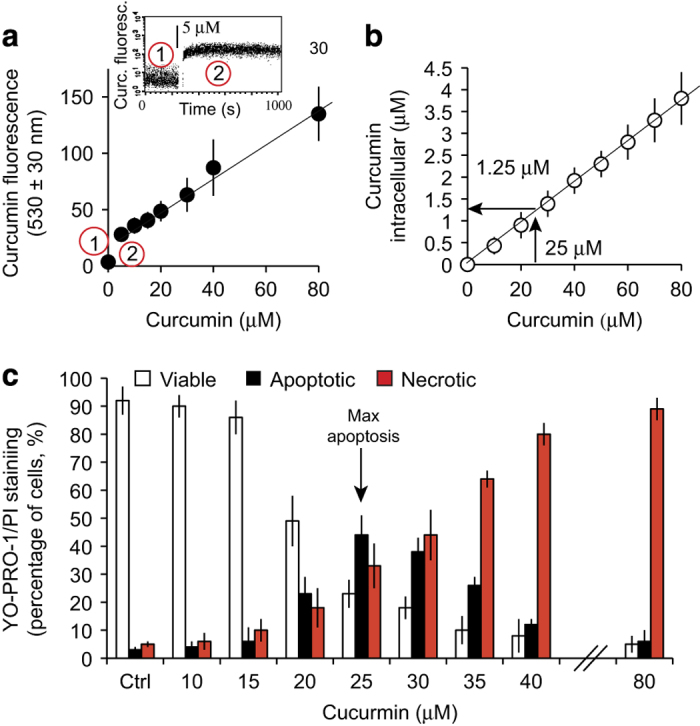
Cellular uptake and intracellular concentration of curcumin and induction of cell death. (a) Flow cytometry measurement of curcumin fluorescence in Huh-7 cells treated with different amounts of curcumin (0–80 μM external concentration). In the upper panel 1 shows the autofluorescence of cells at 530±30 nM (flavoprotein fluorescence), and 2 shows the fluorescence after the addition of a defined amount of curcumin (5 μM). The plotted mean values were recorded after 5 min of equilibration. (b). Intracellular curcumin concentration in μM, as measured by methanolic extraction, of cells treated with various concentrations of curcumin plotted against the external concentration of curcumin (0–80 μM; n=6 independent experiments). Huh-7 cells were used as negative controls (to determine cellular autofluorescence at the wavelength used, i.e., 530±30 nm). (c) Percentage of viable, apoptotic and necrotic cells among cells treated with various concentrations of curcumin for 24 h. YO-PRO-1/PI staining was used to analyze the three populations: YO-PRO-1−/PI− for viable cells, YO-PRO-1+/PI− or YO-PRO-1+/PIintermediate for apoptotic cells and YO-PRO-1+/PI+ for necrotic cells. The maximum of proportion of apoptotic cells is observed at 25 μM of curcumin for 24 h. Data are expressed as the mean±S.D. (n=10).