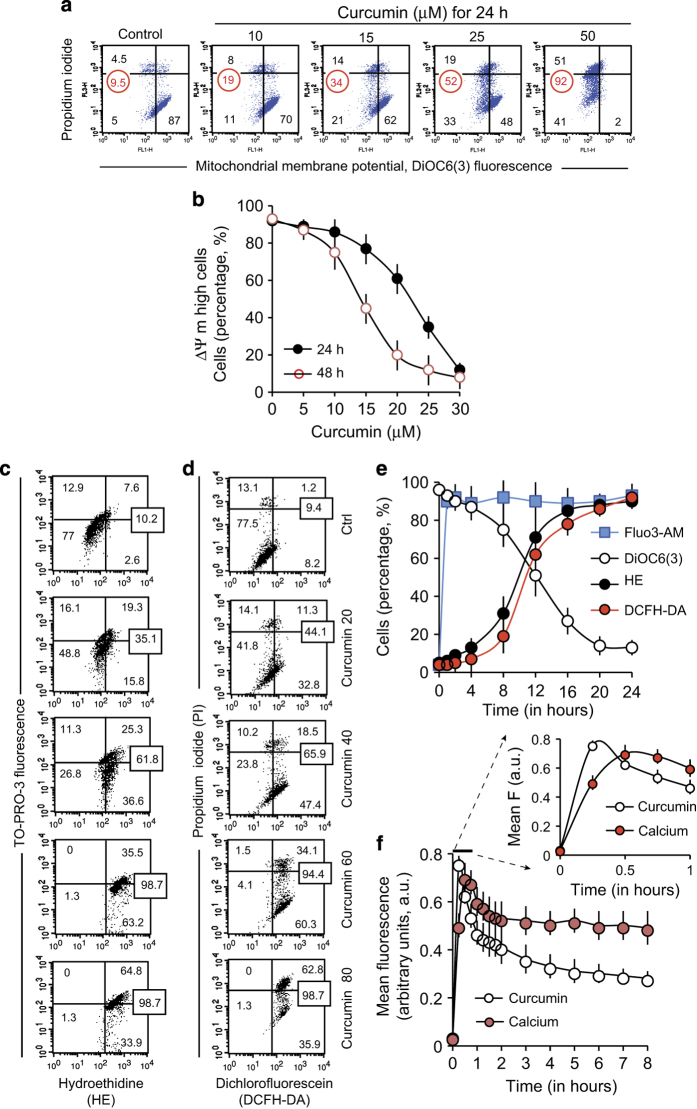
Figure 2.
Flow cytometry analysis of the events linked to curcumin-induced cell death. (a and b) Flow cytometry analysis of the mitochondrial membrane potential (ΔΨm) and membrane integrity by double staining with 20 nM 3,3’-dihexyloxacarbocyanine iodide (from a 10 μM stock solution in ethanol) and 1 μg/ml PI (from a 1 mg/ml stock solution). (c and d) Percentage of cells producing ROS after treatment with various concentrations of curcumin (0–80 μM). Superoxide anion production (c) as measured by the hydroethidine staining, and hydrogen peroxide production (d) as measured by the dichlorofluorescein fluorescence of the DCFH-DA (dichlorofluorescein diacetate). All measurements were made in presence of PI to discriminate between live and dead cells. (e). A 24 h time course of ΔΨm, calcium content (with Fluo3-AM) and superoxide anion and hydroperoxide production in cells treated with 25 μM of curcumin. (f). A 8-h time course showing the rapid uptake of curcumin followed by an immediate increase in calcium levels. In all figures, when a single experiment is shown as an example, the data are expressed as a percentage of the whole population, whereas in concentration or time scale curves, the data are either expressed as mean fluorescence (in arbitrary units)±S.D. or as a percentage (%)±S.D. with n=9.

