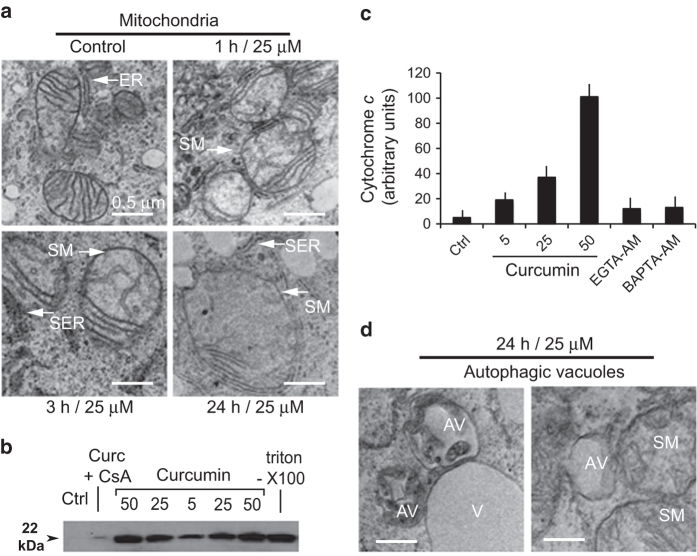
Figure 4.
Electron microscopy of mitochondria and cytoplasm of curcumin-treated Huh-7 cells. (a) Electron micrographs illustrating time-dependent mitochondrial swelling in cells incubated with 25 μM curcumin for 1, 3 or 24 h. (b and c) Western blots of cytochrome c released in cells treated with different concentrations of curcumin, in the presence or absence of cyclosporine A. Triton X-100 treatment results in the release of the total cytochrome c available in cells. (c) Quantification of cytochrome c released in cells treated with different concentrations of curcumin and inhibition of this release by EGTA-AM or BAPTA-AM, which control intracellular calcium levels after curcumin addition. (d) Electron microscopy picture of autophagic vacuoles in cells treated with 25 μM curcumin for 24 h. AV, autophagic vacuoles; SM, swollen mitochondria; V, vacuole.

