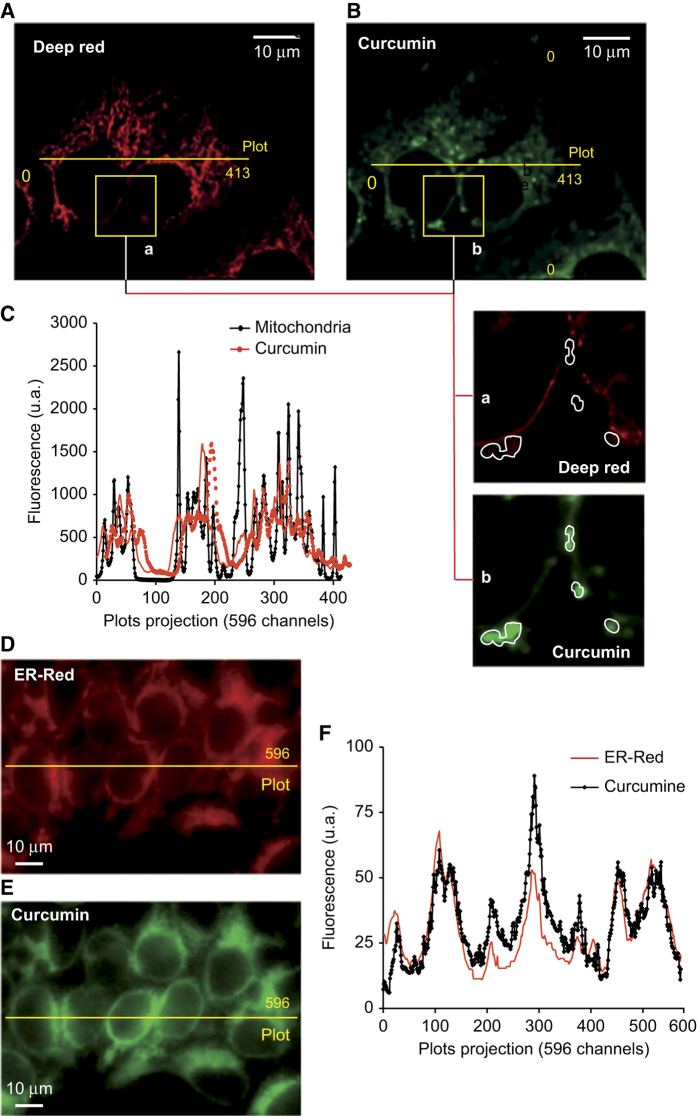
Figure 5.
Confocal microscopy analysis of curcumin autofluorescence and mitochondrial staining with the cationic and lipophilic dye deep red. (A–C) The mitochondrial compartment (A) was stained with 40 nM deep red which fluoresces at 633 nm, whereas curcumin (B) fluoresces at 530±30 nm after excitation at 488 nm. (A and B) Panels (10 μM scale) show enlarged portions of A and B, respectively. Curcumin spots (b) in green are surrounded by lines, which are clearly empty in (a) which shows the deep red staining of the mitochondrial compartment. (C) A plot of fluorescence along the yellow line shown in A and B consisting of 413 pixels. The main peaks corresponding to deep red staining do not co-localize with those corresponding to curcumin fluorescence. In D, the ER compartment was stained with ER tracker red and the picture was taken at 585±20 nm after excitation at 488 nm. (E) Curcumin fluorescence was measured at 530±30 nm after excitation at 488 nm. (F) A plot of fluorescence along the yellow line of 596 pixels shown in the picture; curcumin fluorescence is shown in black and ER-red tracker in red.

