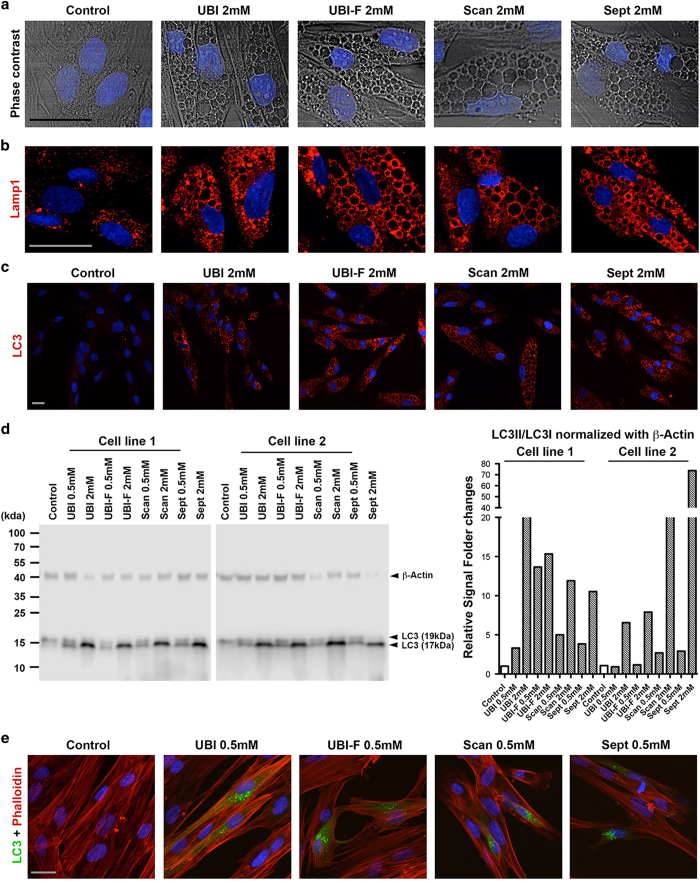
Figure 2.
Local anesthetics induce autophagy in tooth pulp cells. (a) Phase-contrast microscopy images of drug-treated and control cells. (b and c) Immunofluorescence analysis of LAMP-1 and LC3 (red) expression in control cells and cells treated with 2 mM anesthetic drug. (d) Western blot (left panel) analysis of LC3 expression in two primary dental pulp cell lines with and without drug treatment. Note that LC3 is expressed as two isoforms with molecular weights 17 kDa (LC3-II) and 19 kDa (LC3-I). β-Actin was used as a loading control. Signal quantification (right panel) was performed on C-DiGit Blot scanner acquired gel images using Image Studio 4.0 software (LI-COR Biosciences UK Ltd, Cambridge, UK). Relative signal was calculated as LC3II (17 kDa) versus LC3I (19 kDa) then normalized against β-Actin signal. (e) GFP–LC3 fusion protein expression (green) in control cells and cells treated with 0.5 mM anesthetic drug. Cells were counterstained for Phalloidin (red). Cell nuclei were visualized using 4′,6-diamidino-2-phenylindole (DAPI). Additional analysis can be found in Supplementary Figure 2. Scale bars, 20 μm. UBI, Ubistesin; UBI-F, Ubistesin forte; Scan, Scandonest; Sept, Septanest. Scale bars, 10 μm.

