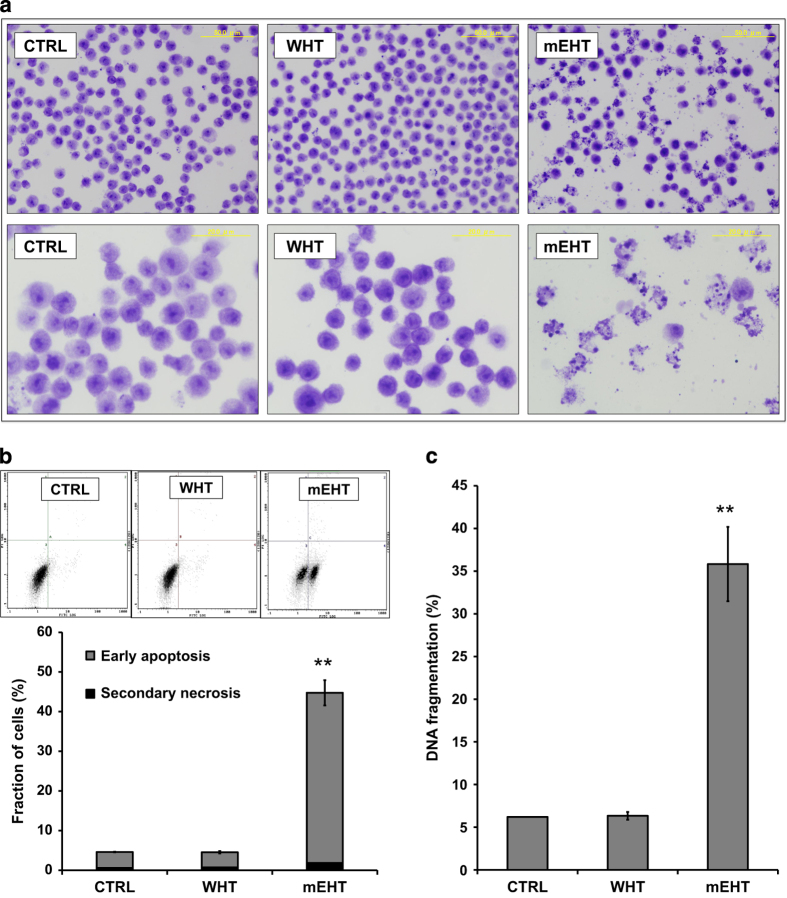
Figure 2.
Representative microscopy images of untreated control, WHT-treated and mEHT-treated cells, 3 h post-treatment in Giemsa stained cell samples (a). Representative flow cytometric histogram of the Annexin V-FITC and PI staining 3 h after treatment. The quantitative analysis shows a significant increase of Annexin V positive-cell fraction only in mEHT samples (b). Quantitative results from DNA fragmentation assay. The mEHT-treated cells showed a significant increase in DNA fragmentation percentage, which is one of the hallmarks of apoptotic cell death (c). The results are presented as the mean±S.D. (n=3). **P<0.01 as compared to WHT treatment.

