Figure 2.
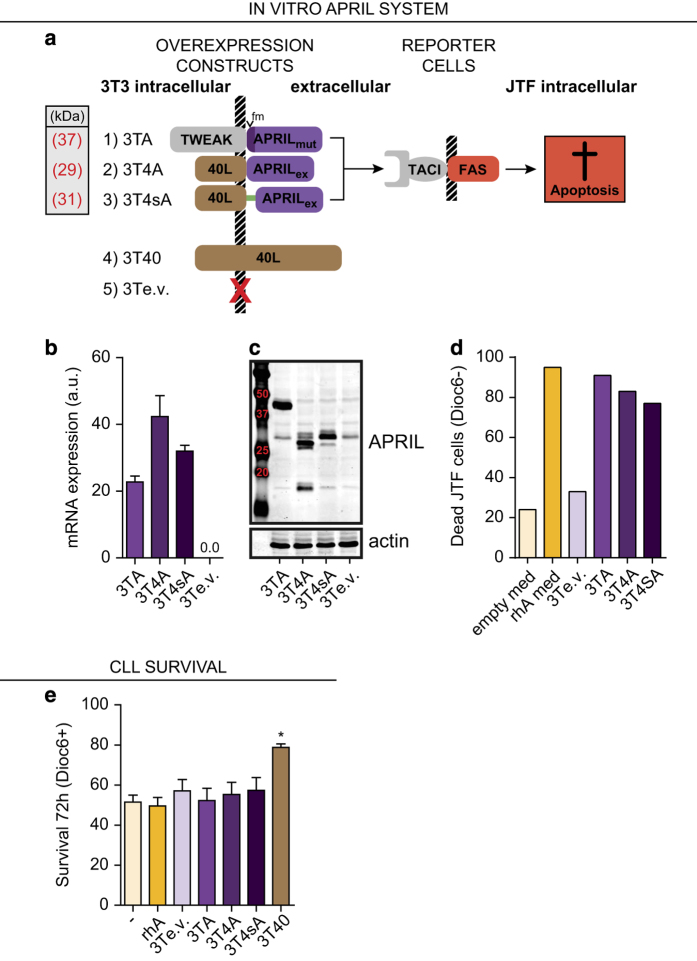
APRIL does not induce CLL cell survival. (a) Depiction of APRIL overexpressing cell lines, control cell lines, and reporter cells used in co-culture experiments. NIH-3T3 cell lines overexpressing three different membrane-bound APRIL constructs were created (Methods section). Apoptosis in APRIL reporter JTF cells is induced on APRIL signaling, as TACI signaling triggers the FAS cell-death pathway. Full-length CD40L overexpressing 3T3 cells (3T40) and empty-vector transduced 3T3 cells (3Te.v.) are used as controls. Mutated furin sites are indicated by ‘fm’, the spacer region is depicted by a green line. All constructs are drawn to scale. (b) APRIL mRNA expression levels of the different APRIL overexpressing cell lines were tested by qPCR and compared with cells overexpressing 3Te.v. The qPCR was performed in triplo and bars show mean±S.E.M., a.u. denotes arbitrary units. (c) APRIL protein expression levels of the different APRIL overexpressing cell lines were tested by western blot and compared with cells overexpressing 3Te.v. The predicted molecular weights of the APRIL fusion proteins are indicated in Figure 2a. (d) Cell lines described in Figure 2a were seeded as feeder layers, and JTF reporter cells27 were plated on top. Concurrently, JTF reporter cells were cultured in conditioned medium from APRIL (rhA med) or mock (empty med) transfected HEK293T cells. After 24 h co-culture, the percentage of dead (Dioc6 negative) JTF reporter cells was determined by Dioc6-PI staining. (e) CLL cells were cultured for 72 h without stimulation (–) or with 200 ng/ml rhA. Likewise, CLL cells were co-cultured on the indicated APRIL expressing or control cell lines. Next, survival was determined by Dioc6-PI staining. Viable cells were defined as Dioc6-positive cells. CD40L overexpressing feeder cells (3T40) were used as a positive control for CLL cell survival. Bars show mean±S.E.M. for N⩾8 for each condition. *P<0.05 in a ANOVA with Tukey post hoc tests. When testing for significant differences, rhA was compared with unstimulated cells and 3T3 overexpression cell lines to 3Te.v.

