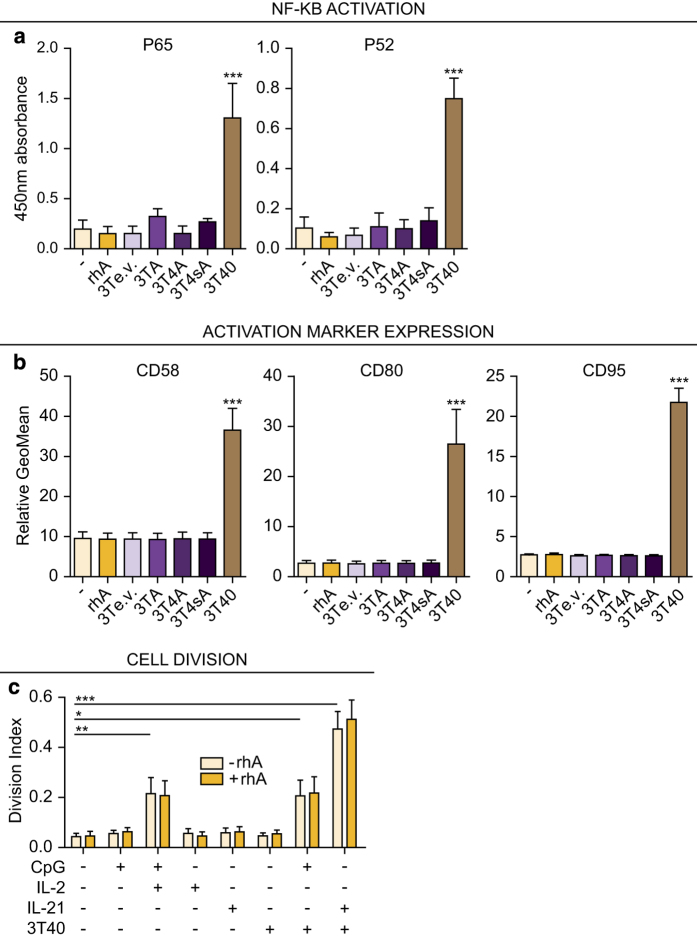
Figure 3.
APRIL does not induce NF-κB signaling, activation marker expression, or cell division in CLL cells. (a) CLL cells were cultured as in Figure 2e and nuclear extracts were prepared after 24 h. The binding of activated canonical p65 and non-canonical p52 NF-κB subunits to consensus sequence oligonucleotides was then determined using enzyme-linked immunosorbent assay (ELISA). CD40L overexpressing feeder cells (3T40) were used as a positive control for NF-κB activation. Bars show mean±S.E.M. for N=3 for 3TA and 3T4sA and N=5 for the other conditions, respectively. ***P<0.001 in an ANOVA test with Tukey post hoc analysis. When testing for significant differences, rhA was compared with unstimulated cells and 3T3 overexpression cell lines to empty-vector transduced 3T3 cells (3Te.v.). (b) CLL cells were cultured as in Figure 2e for 72 h and expression levels of activation markers CD58, CD80 and of CD95 were determined using flow cytometry. CD40L overexpressing feeder cells (3T40) were used as a positive control for activation marker induction. Bars show mean±S.E.M. for N=3. ***P<0.001 in an ANOVA test for repeated measures with Tukey post hoc analysis. When testing for significant differences, rhA was compared with unstimulated cells and 3T3 overexpression cell lines to 3Te.v. (c) CFSE-stained CLL cells were cultured with various stimulations as indicated and as described,2 each time with or without rhA. After 4 days, the CFSE dilution was visualized by flow cytometry and division indices were calculated. Bars show mean±S.E.M. for N=6. *P<0.05; **P<0.01; ***P<0.001; Each stimulation without rhA (light colored bars) was compared with the unstimulated condition in an ANOVA test for repeated measures with Dunnet’s post hoc analysis and the differences between − and +rhA for each condition were determined using a two-way ANOVA with Bonferroni correction.

