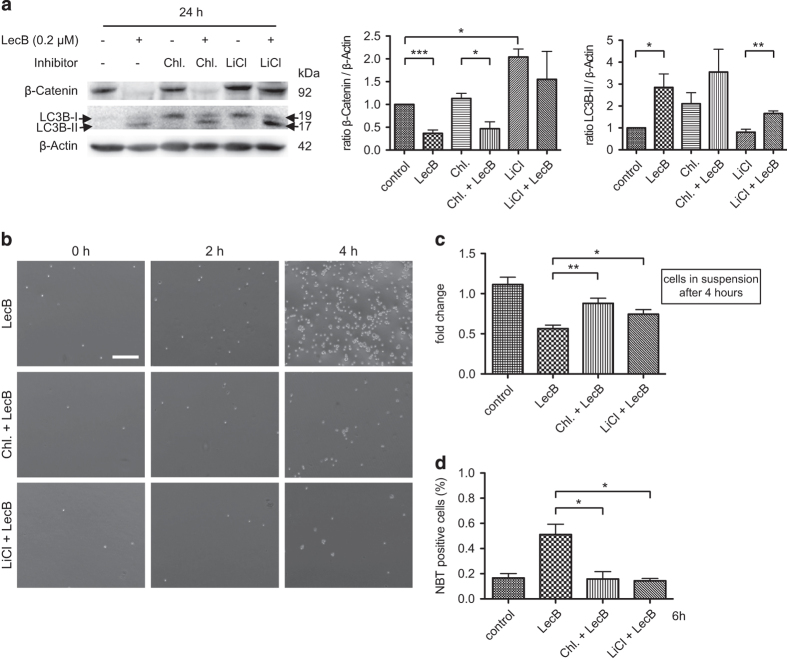
Figure 4.
Autophagy and the β-Catenin level regulate differentiation. THP-1 cells were treated for 24 h with 0.2 μM LecB±the autophagy inhibitor chloroquine (Chl.: 10 μM) or the GSK-3 inhibitor lithium chloride (LiCl: 20 mM) that stabilized the β-Catenin level. (a) Western blot analysis and quantification. The shown results illustrate the fold increase of LC3B-II (arrows) and the β-Catenin expression normalized to β-Actin. (b) The graph depicts light microscopy images of THP-1 cells treated with LecB (0.2 μM)±inhibitor for the indicated time points. The inhibitors were capable to counteract LecB-induced attachment to a cell culture plate. Scale bar, 250 μM. (c) The number of cells remaining in suspension upon treatment was determined at indicated time points. Results are expressed as fold change of the cell amount present in the samples relative to the amount at time point 0. (d) Quantification of an NBT assay of cells treated with the appropriate combinations for 6 h compared with only LecB-treated cells. Values represent the amount of NBT-positive cells relative to the total amount of cells. The results represent the mean±S.E.M. of at least three independent experiments. *P<0.05; **P<0.01; ***P<0.001.

