
Figure 3.
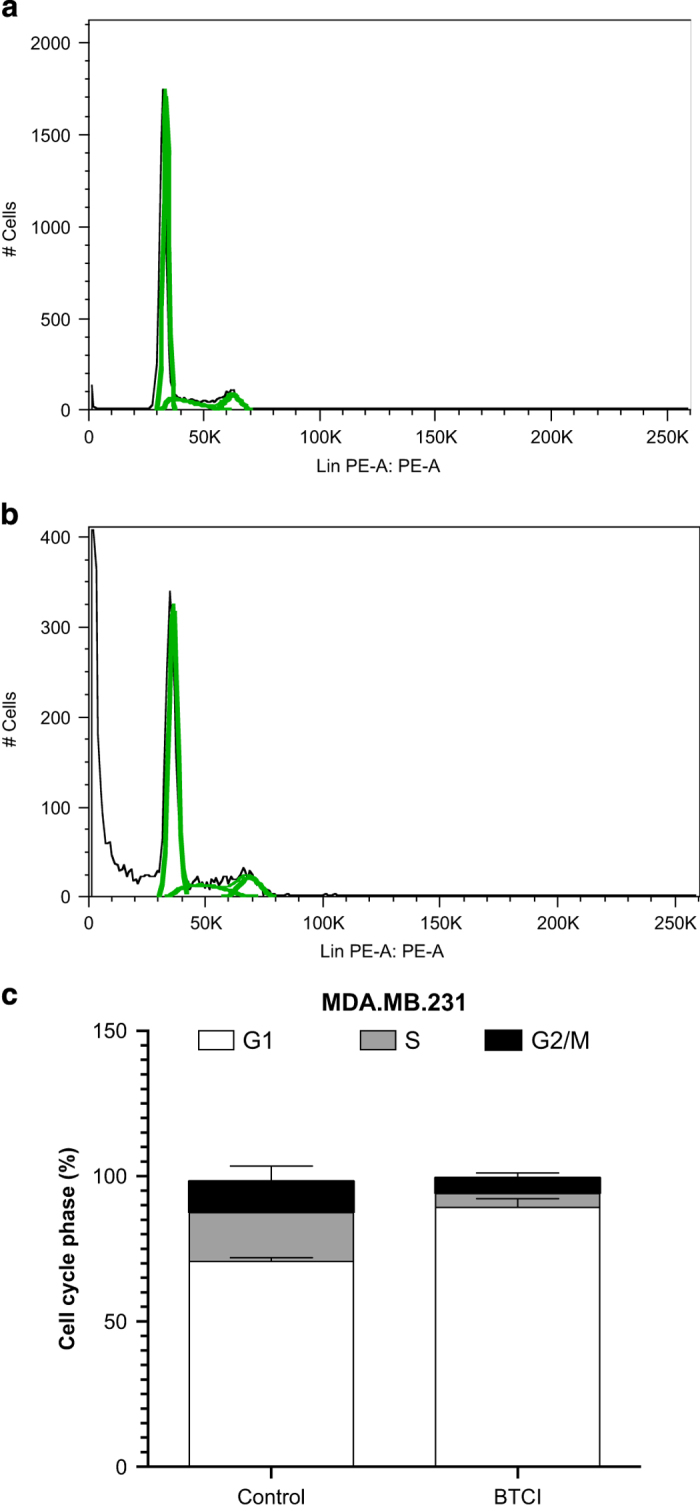
Effects of BTCI on DNA content. MDA-MB-231 cells were incubated with 100 μM of BTCI for 24 h. DNA contents in Sub-G1 phase were analyzed using flow cytometry. Representative flow cytometry images were shown (a and b). (c) The DNA profile representing cells in sub-G1/G1, S and G2/M phases. Results are represented as means±S.D. of two separate experiments conducted in triplicate, P<0.05 versus untreated cells.