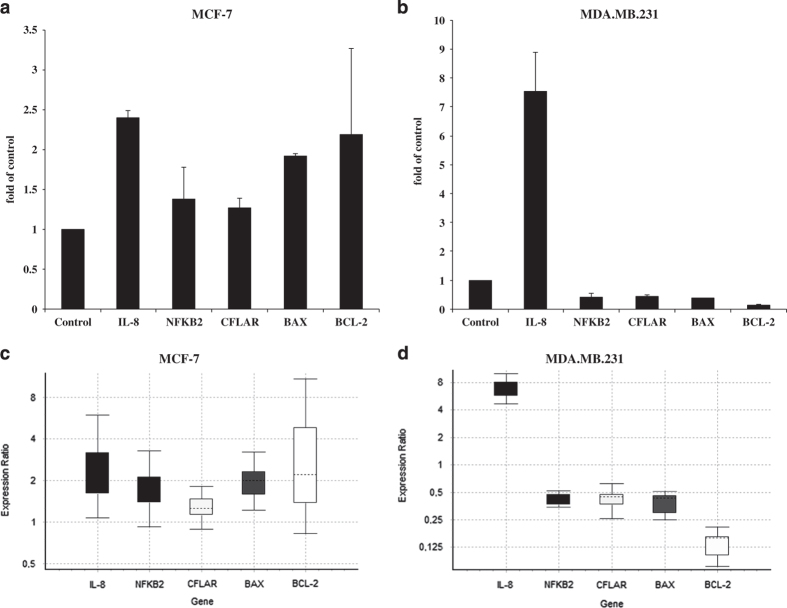
Figure 8.
mRNA expression of IL-8, NFKB2, CFLAR, BAX and BCL-2 quantified by RT-PCR in human breast adenocarcinoma cells. Cells were treated with BTCI for 24 h, and RNA was extracted. This RNA was used to prepare cDNA that was subject to real-time PCR to quantify the mRNA level of each gene. Each sample was run in triplicate, and the relative amount of mRNA was normalized to the β-actin content in each sample. Normalized expression values (specific gene expression levels/β-actin expression levels) are presented. Data points are represented by the expression ratio and mean±S.D. fold of control in MCF-7 (a and b) and MDA.MB.231 (c and d). Each RNA sample represents a pool of RNA samples from two independent biological experiments conducted in triplicate, *P<0.05 versus untreated cells.

