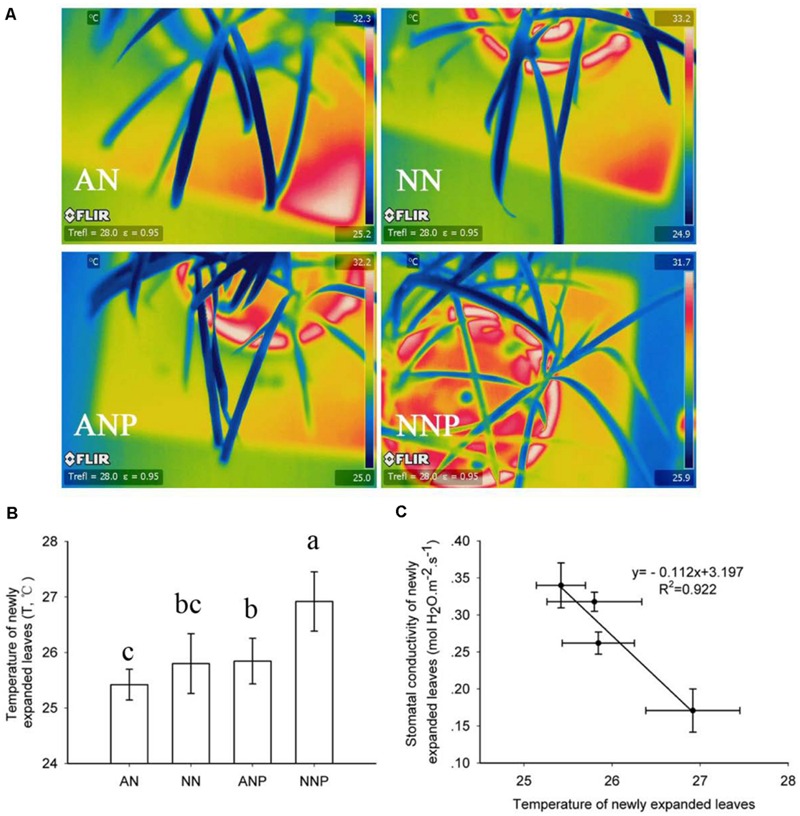
FIGURE 2.

Effects of different nitrogen forms and drought stress on leaf thermo image (A), leaf temperature (B) and the correlation between stomatal conductivity and leaf temperature (C). A thermograph was taken before measuring the leaf photosynthetic rate. To calculate leaf temperature, 11 leaves were taken from the thermo image. The error bars indicate the ±SD. Significant differences (P < 0.05) between treatments are indicated by different letters. Rice seedlings were supplied with ammonium or nitrate under control and drought stress stimulation by adding 10% PEG6000 (NH4+ + PEG as ANP; NO3- + PEG as NNP).
