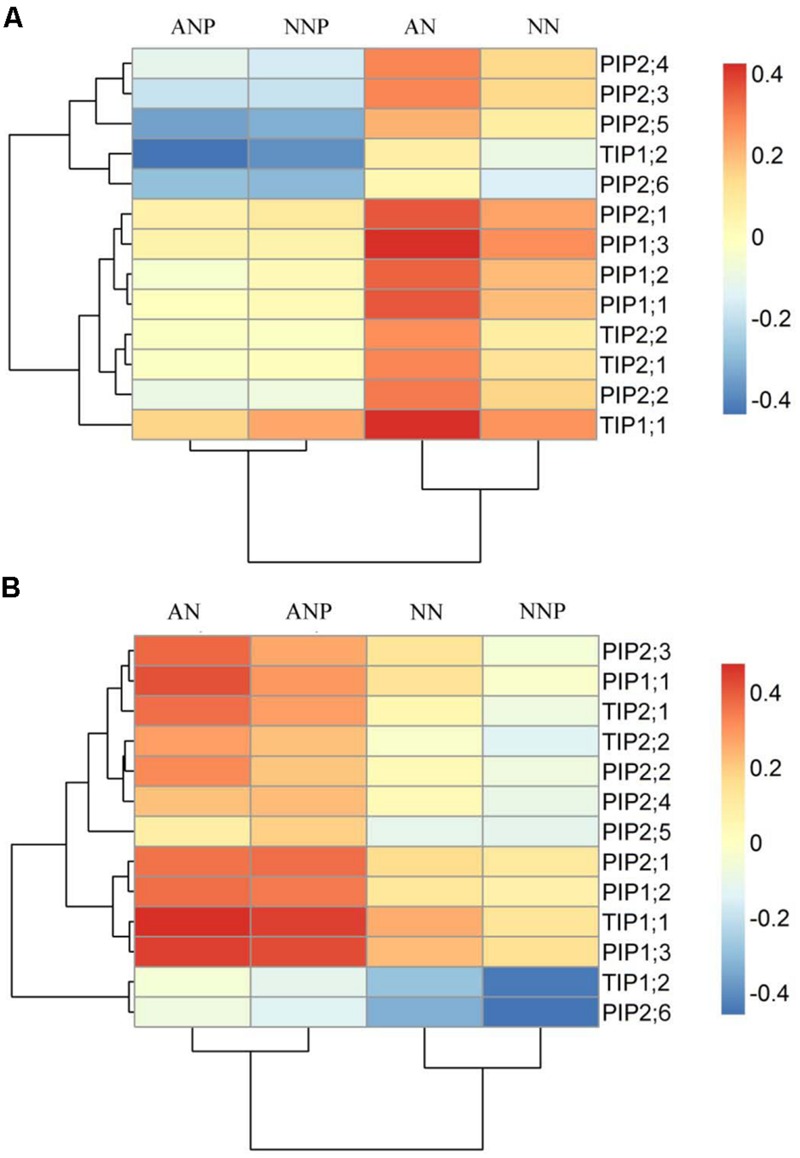
FIGURE 4.

Effects of different nitrogen forms and drought stress on root PIP and TIP gene expression. Root PIP and TIP expression was detected after 4 h (A) and 24 h (B) of PEG treatment. The data were from RT-qPCR and were analyzed with 2-ΔCt and further normalized with the log10 method. Red represents higher in transcript levels than blue colors as indicated in figure. The treatment tree and gene tree were generated based on the expression pattern. The data represent the means of three replicates. Rice seedlings were supplied with ammonium or nitrate under control and drought stress simulated by adding 10% PEG6000 (NH4+ + PEG as ANP; NO3- + PEG as NNP).
