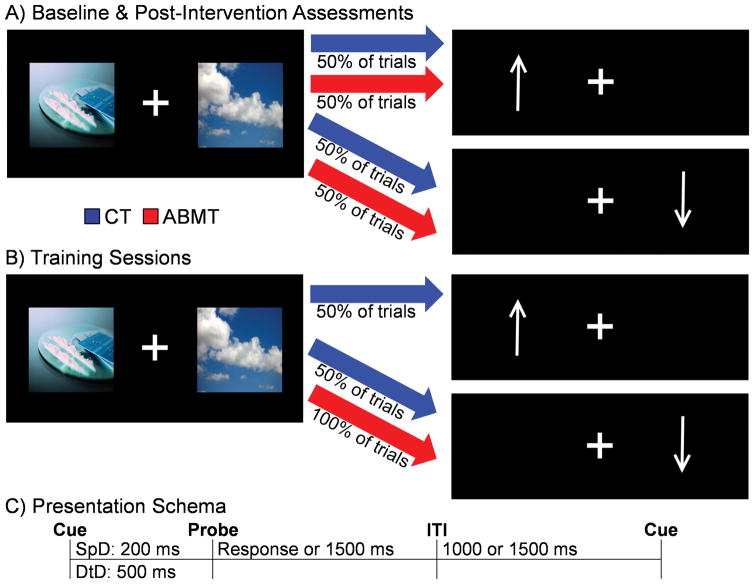
Fig. I. Attentional Bias Modification Trial Distribution and Presentation.
This figure illustrates the frequency with which a visual probe replaced either cocaine-related pictures or neutral pictures in the control (CT; blue) and attentional bias modification therapy (ABMT; red) conditions for both the pre- and post- intervention measures (Panel A) and during training sessions (Panel B). Cue pictures were presented (Panel C) for either 200 ms (speeded detection: SpD) or 500 ms (difficulty to disengage: DtD), with a response window of 1500 ms following cue presentation and a variable inter-trial interval (ITI).

