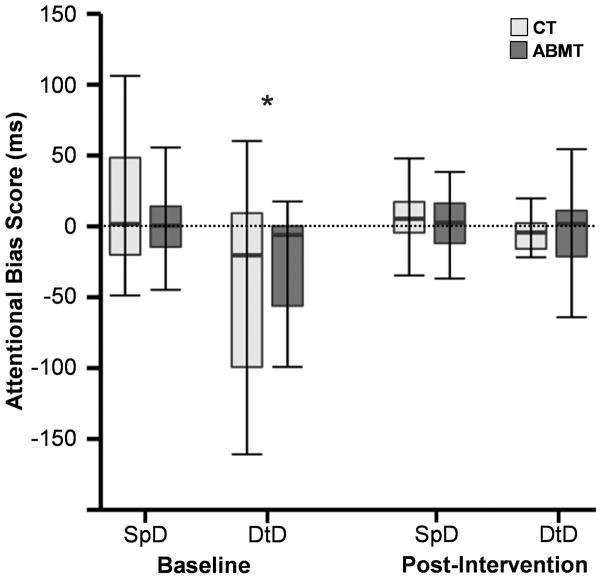
Fig. III. Attentional Bias Differences Between Groups.
This figure presents attentional bias data for control (CT; light grey) and attentional bias modification therapy (ABMT; dark grey) patients at baseline and post-intervention. Attentional bias was measured by subtracting response times in trials where the probe replaced cocaine-related pictures from trials where a probe replaced neutral pictures. Box and whisker plots are used to present data for probes presented at 200 ms stimulus duration (SpD: speeded response) and 500 ms stimulus duration (DtD: difficulty to disengage). An asterisk denotes the presence of significant bias (here interference), measured as deviation from zero (dotted line)

