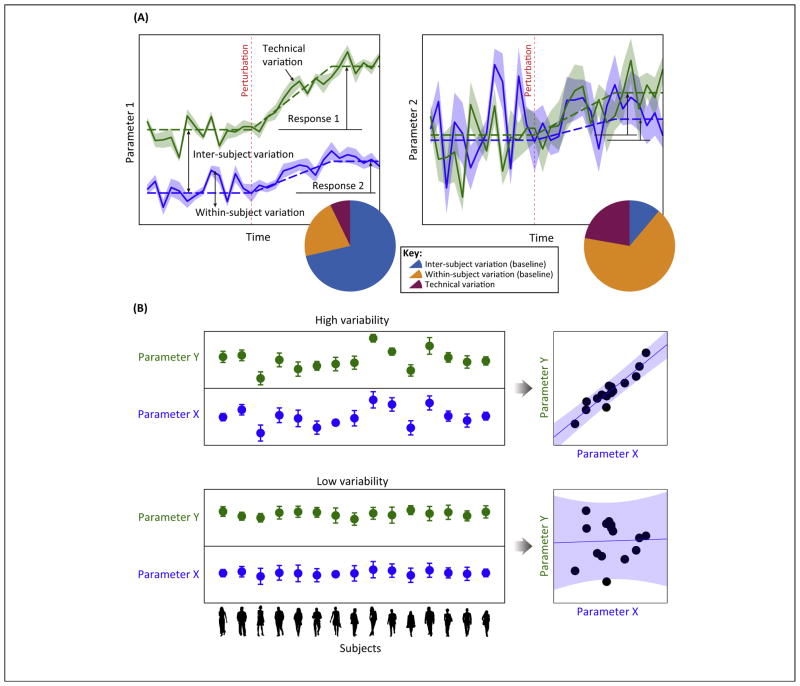
Figure 1.
(A) Illustration of the dynamical trajectory of two hypothetical parameters within two subjects (green and blue lines) before and after a perturbation. At any given moment (e.g., a snapshot measurement of the parameter in both subjects) before the perturbation (i.e., ‘baseline’), the total amount of observed variability can be attributed to inter-subject differences, temporal variations within subjects, and technical variation (or measurement noise – as indicated by the thickness of the shade). The measured variation in parameter 1 (left panel) is dominated by inter-subject variation (decomposition of variation is illustrated using a pie chart), and thus is an example of a temporally-stable parameter – in other words, inter-subject difference is well maintained regardless of when the measurement is made. Parameter 2 (right panel) exhibits lower subject-to-subject differences, but the fluctuations within subjects are much higher relative to parameter 1. Parameter 2 is an example of a temporally-unstable parameter. Both subjects responded to the perturbation by increasing the value of parameter 1, but the amount of increase relative to the baseline is different across the two subjects, thus showing a qualitatively-consistent change (i.e., a coherent change) that is quantitatively variable (i.e., a response variation). Parameter 2 also showed an increase in value after the perturbation but, owing to the amount of fluctuations within subjects, this coherent change is difficult to detect statistically. (B) Extensive subject-to-subject variability is essential for assessing correlation between two parameters. The top panel illustrates a scenario where two biologically associated parameters X and Y exhibit substantial subject-to-subject variability relative to measurement noise (indicated by error bars), which in turn enables robust detection of correlation between these two parameters (right scatter plot). The bottom illustrates an opposite scenario: the two parameters here are also biologically associated (i.e., they co-vary) but, because the amount of inter-subject variation is small relative to measurement noise, detection of correlation is impossible (right scatter plot).

